By Jonathan Coppess, Gary Schnitkey.et.al
As discussed previously, the Market Facilitation Program (MFP) created by the Trump Administration in response to the tariff conflict it initiated is arguably an unprecedented effort and may signal a new direction in farm policy (farmdoc daily, November 21, 2019). According to USDA, the 2019 MFP has made $10.33 billion in payments through December 3, 2019 (USDA, farmers.gov). The various impacts of these payment, such as for cash rent, remain subjects for continued analysis (see e.g., farmdoc daily, November 26, 2019; September 25, 2019; see also, Glauber 2019). This article adds to the analysis by seeking to measure MFP payments in terms of historic net cash farm income and government payments.
Background
As discussed previously, the Market Facilitation Program (MFP) may well represent a new direction in farm policy because of its size and the creative interpretation of existing authorities under the Commodity Credit Corporation Charter Act (farmdoc daily, November 21, 2019). Figure 1 provides an historical perspective on net cash income and direct government payments. It compares net cash income without government payments and the income from all government payments (both conservation and all other payments) from 1929 to the 2019 forecasts as reported by USDA’s Economic Research Service (ERS, Wealth and Income Statistics). It also compares the low levels of net cash income in the Great Depression, the Eighties economic crisis and the modern low in 2000. The data has been adjusted for inflation by ERS so that all years and amounts are illustrated in Figure 1 in real (2019) dollars.
Discussion
As Figure 1 indicates, since the Great Depression there have been two major low points in terms of net cash income. The first was during the Eighties farm crisis that followed from expansion in the wake of the all-time peak in 1973; the second was during the Asian financial crisis after the 1996 Farm Bill and into the new millennium. The most recent downturn in net cash income thus far is less than historic events but has fallen compared to the 2012 peak; net cash income has thus far remained above the levels of the previous two lows as adjusted for inflation to 2019 dollars. Figure 2 illustrates one measurement of declines in net cash income without government payments for the three eras. It takes the net cash income without government payments at the lowest point, averaging it with the year before and after (e.g., 1984 low averaged with 1983 and 1985), subtracted from the peak as averaged with the year prior and the year after (e.g., 1973 peak averaged with 1972 and 1974). This is repeated for the other two eras. Not surprisingly, the income lost during the 1980s farm crisis is the largest lost among the three eras by this measure. Using this method, the lowest level in the Eighties (1983-1984-1985 average) was 52.5% of the highest level from the Seventies (1972-1973-1974 average); the lowest level around 2000 (1999-2000-2001 average) was 69% of the highest level in the Nineties (1994-1995-1996 average); and the recent low (2017-2018-2019f average) is just over 68% of the recent peak (2011-2012-2013 average).
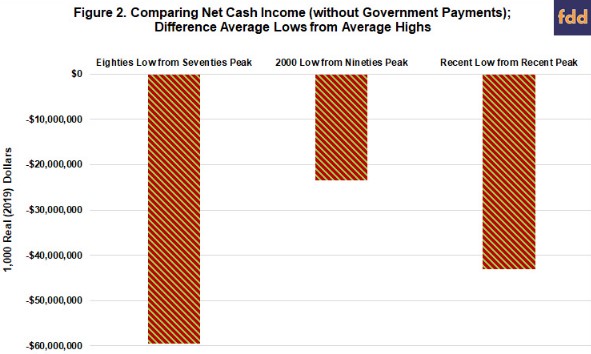
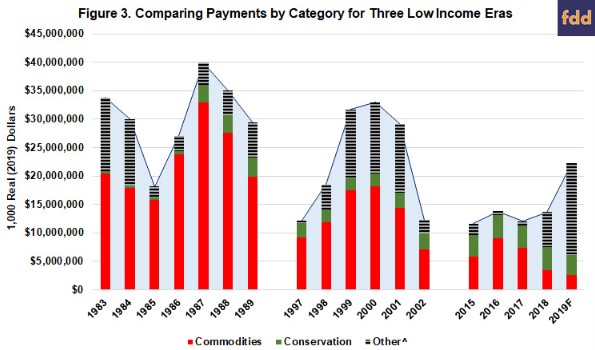
Figure 3 illustrates the total direct government payments by category for these and additional years during the three eras of low net farm income from the ERS data in Figure 1; the eras are 1983 to 1989, 1997 to 2002 and 2015 to the 2019 forecast. The commodities programs cover direct payments from target prices (1980s), production flexibility contracts (1990s) and from ACRE, ARC, PLC and the cotton payments (transition and ginning); these payments also include assistance provided through the loan programs (marketing loan gains and loan deficiency payments). The other category includes miscellaneous, supplemental and ad hoc payments; this presumably includes the Payment-in-Kind (PIK) program in 1983, as well as including the market loss assistance payments authorized by Congress in multiple appropriations bills in the late 1990s. The MFP payments are included in this category for 2018 and the 2019 forecast years.
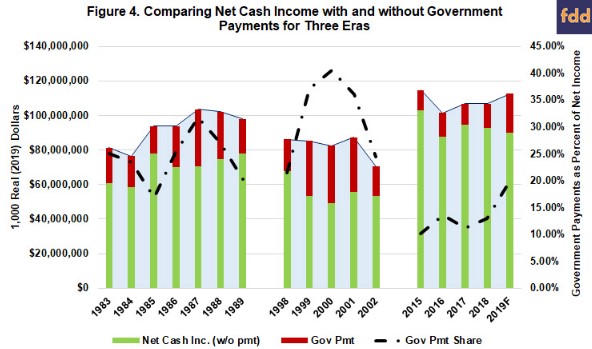
Just as the decrease in net cash income (without government payments) was more severe in the Eighties, so too the government payments were much larger in that era. Figure 4 completes the comparison across these three low income eras. It combines the net cash income without government payments with the government payments, all adjusted for inflation to real (2019) dollars; the stacked bars representing total net cash income. Figure 4 also includes the percentage of total net cash income attributed to the government payments in each year. Again, total net cash income is higher in the current era than the other two and less of the income is from government payments. The 2019 forecast for just under 20% of net income from government payments compares to 1989 (20.4%) and 1998 (21.4%); years that represent the tale-end of the Eighties crisis and the beginning of the late 1990s problems, respectively.
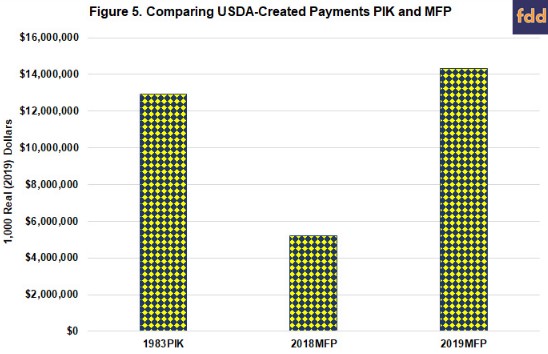
In terms of government payments, even with MFP, the 2019 forecast of $22.4 billion is below the highest level of payments in the earlier eras, adjusted for inflation; the highest was $33.4 billion in 2000, followed by $32.98 billion in 1987. Both of those payments, however, were authorized directly by Congress either in a farm bill or from appropriations. The closest historical analogue for MFP would be the Payment-in-Kind (PIK) program initiated by the Reagan Administration in 1983, although that program effectively reinstated policy created by Congress in the 1960s. In terms of USDA-created payments, the 2019 MFP payments forecast of $14.3 billion is the highest level, topping the 1983 PIK ($12.9 billion) adjusted for inflation by ERS; 2019 MFP is forecast to exceed the 1983 PIK by more than a billion dollars. Figure 5 illustrates the comparison.
It is also worth noting that the two programs are not exactly comparable, although both amounted to direct income transfers to farmers. The 1983 PIK program was designed to remove acres from production as the economic crisis deepened. Farmers were provided certificates on commodities under CCC storage that had been forfeited through the loan programs; the certificates were intended to provide the farmer income that replaced anticipated income from planting acres to those crops. The program removed nearly 78 million acres from production in 1983 (see e.g., farmdoc daily, November 14, 2019). MFP, however, is a direct cash payment to farmers that is coupled to production; the 2018 payments were on actual bushels of production, the 2019 payments were based on acres planted.
Concluding Thoughts
As the second tranche of MFP payments for 2019 pushes total payments to farmers above the $10 billion mark, the discussion above seeks to provide historical perspective on the program in terms of past eras of low net cash income and high levels of government payments. Farmers have lost significant net cash income as the tariff conflict initiated by the Trump administration continues; they have received unprecedented direct cash infusions in response. Thus far, the impacts on net cash income have not been as drastic as experienced in the 1980s. Total government payments have been neither as large, nor as high a share of net cash income, as during the 1980s or the years at the turn of the millennium. An important aspect of MFP that separates it from the historical crowd is that it was initiated by the Administration without any direct Congressional authorization or appropriation.
Source : farmdocdaily