SkyClaim converts drone maps into crop damage reports
By Diego Flammini
Staff Writer
Farms.com
Farmers can use a new mapping tool to help identify potential crop losses in their fields.
Calgary’s Skymatics developed SkyClaim, which transforms aerial maps into crop damage reports.
“Producers or insurers can upload that map onto skyclaim.io, where we have many different layers of analysis to highlight and classify crop damage within those maps,” the sales and marketing coordinator with Skymatics told Farms.com today.
About 40 crops are listed in SkyClaim’s database including corn, canola and wheat. Vineyards and orchards aren’t part of the platform’s crop inventory.
Once users upload maps, they can enter customized information and pinpoint the areas on the farm they wish to examine in greater detail.
“Things like the map’s capture date are very important,” said the spokesperson. “If you’re talking about hail damage that’s one day or 10 days after a storm, that can make a big difference.
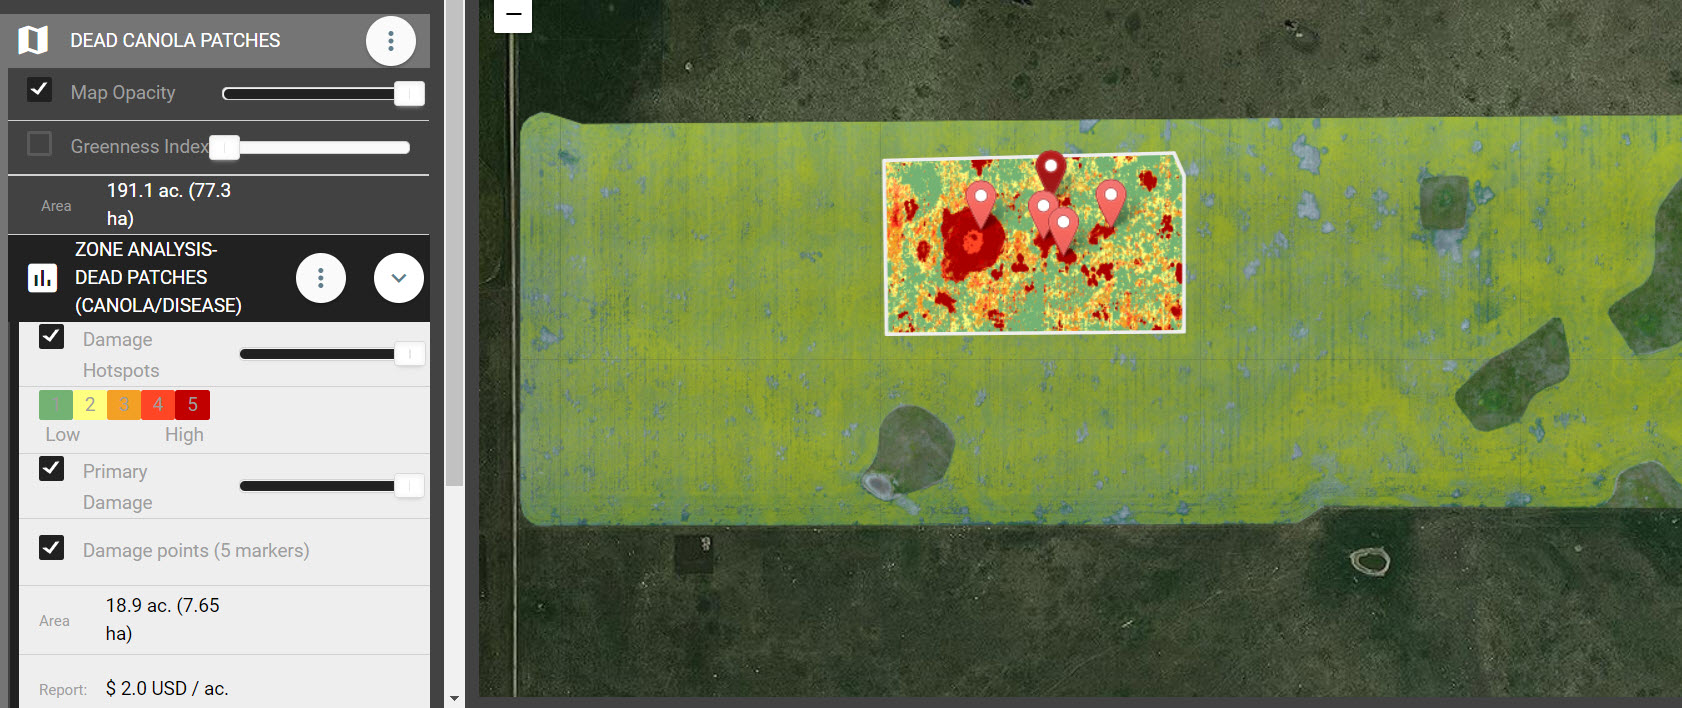
SkyClaim screenshot
“As someone is uploading their map they get to pick damage hotspots,” the spokesperson added. “They can pick five points in total and say ‘This point right here is the most damaged point.’ That tells us to go through the map and find all of the points that are similar.”
SkyClaim can identify two specific types of damage.
“If you have a map and you want to assess the wildlife damage, we can do that,” the spokesperson said. “If you want to determine the damage from flooding, we can do that too. But we’ve set (the system) up in such a way so that, in the future, we can identify and classify more sources of damage.”
The information farmers enter into the system can help them ensure they receive the proper compensation should they have to submit insurance claims.
“If you receive a claim from your insurer saying your crop is 30 per cent damaged and you know for a fact it’s at least 50 per cent damaged, you can have this data to back that up,” the spokesperson said. “We’ve seen adjustments of $100,000 go in favour of the producer because of the analytics.”
Users can upload a map free of charge and only pay for the damage reports they wish to receive.
Skyclaim.io also has demonstration maps farmers can use to become familiar with the tool.