Precision ag techniques providing a ROI at the farm level
By Ryan Ridley
Farms.com
The modern farmer utilizes many precision ag tools on their operation, the difficult part is figuring out how it can best provide a return on investment.
Wes Anderson discusses how data layers can be used to “prove that these methods of precision agriculture can in fact provide an ROI at the farm level” with attendees of the 2020 Farms.com Virtual Precision Agriculture Conference & Ag Technology Showcase.
Anderson is Senior Fertility Specialist at Croptimistic Technology and CropPro Consulting, working closely with farm clients to enhance their fertility program using SWAT MAP variable rate technology.
He explains that agronomy at a high resolution involves three steps:
- Recognize that responses to inputs usually vary across a landscape, not just from field to field.
- Map, measure, and manage that variability using data that correctly delineates areas of similar response characteristics.
- Apply agronomy to make a recommendation – but at a higher resolution.
“You can [compare] it to TV resolution,” explains Anderson. “Where treating all the wheat on your farm, for example, would be like a 720p resolution screen; managing it field specifically might be more like a 1080p; and now we’re talking about ultra-high definition 4K where we’re looking at differences within a field and across the landscape.”
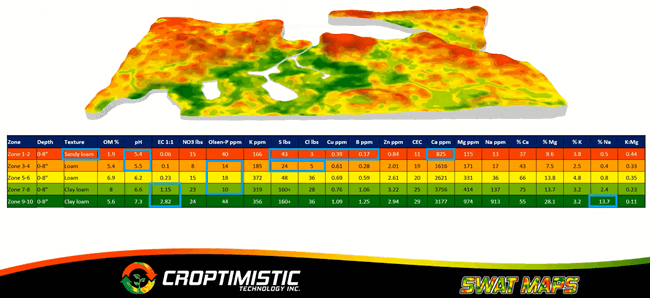
For soil applied inputs, Croptimistic Technology uses a SWAT MAP (soil, water and topography map) for its base layer.
The red zones below represent Zone 1, the driest parts of the field, which Anderson notes could be related to landscape position or soil texture, while the dark green zones represent Zone 10, the areas of the field that are the wettest.

Using the above as an example, Anderson discusses the variability across the field and what factors are impacting yield.
“To be successful and provide a ROI at the farm level, we need to really understand what the limiting factors are. We don’t need to understand that it’s poor, we need to understand why it’s poor. That’s where a SWAT MAP data layer comes in useful,” says Anderson.
Anderson further explains that a plant’s responsiveness to nutrients is determined by more than just soil test values – nutrient parts per million or pounds per acre are only one measurement.
“Understanding all the differences in the landscape like mineralization potential, that is affected by both organic matter and relative water gradient, are also important factors. That’s where the power of a layer like SWAT MAPS comes in – it really accounts for really all those things,” he says.
Anderson goes on to discuss variable seed rates, in crop fungicide, crop and weed density, irrigation and more.
For more information and practical applications of a SWAT MAP, watch the below video with Anderson.
Photo: swatmaps.com/croptimistic