The Land Values 2021 Summary report, released last Friday by USDA’s National Agricultural Statistics Service, shows agricultural land values increasing at a rate not seen in nearly a decade. This report and its contents provide one of many indicators of the overall health of the agricultural economy and help paint a picture of costs that farmers face as they negotiate rent levels for the near future.
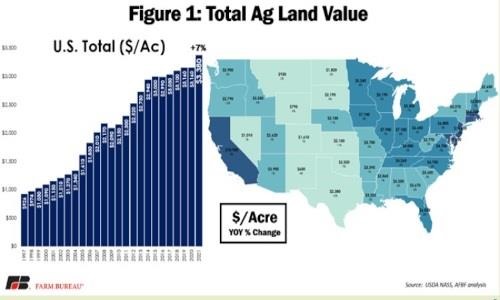
Farm Real Estate Value
The U.S. average farm real estate value, a measurement that includes the value of all land and buildings on farms, clocked in at a record $3,380/acre. This 7% increase over last year represents a percentage change not seen since 2014 when values increased 8% over the previous year. In looking at the dollar value of the change, this is a $220/acre increase over 2020, a level not seen since 2012. These levels vary significantly throughout the country, with the highest real estate values concentrated in areas of the country with larger volumes of high-value crops (think wine grapes and tree nuts in California), as well as areas experiencing upward pressure due to proximity to urban areas. Much of the Midwest experiences higher levels of real estate values, followed by the South and Pacific Northwest, and finally the Plains and Mountain states. On a state-by-state basis, (excluding Northeast states with urban pressure), Nebraska, Kansas and Oregon all posted double-digit percentage changes over last year. These were followed by Texas, Iowa, California and South Dakota, each posting over 9% year-over-year growth.
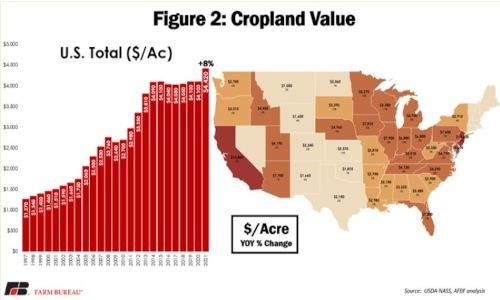
Cropland Value
Like the overall real estate value, average U.S. cropland values posted sharp increases in 2021, rising to $4,420/acre. This increase came in as an 8% jump over 2020, which was the highest increase in cropland since 2013 when it jumped 14%. In dollar values, this year-over-year increase was $320/acre, also not seen since 2013. The distribution across the country follows a similar pattern as overall real estate value, with California and Northeast urban states claiming the highest average cropland values. Again, following that top category is much of the Midwest, followed by the South/PNW, and then the rest of the country. The top three states in terms of percentage growth are Kansas, Nebraska and South Dakota, posting gains of 13.9%, 13.8% and 11.9%, respectively.
Click here to see more...