By David Bau
The average cash price for corn and soybeans each calendar year since 2003 is listed in Table 1 below. Columns 2 and 3 list the average cash prices each year in Worthington for corn and soybeans. The Column 4 lists the average percent change in corn and soybean prices from the prior year. Column 5 lists the average rent paid by 1200 farmers in Southern Minnesota who are part of Adult Farm Management Programs. Column 5 multiplies the price percent change by previous year’s actual average rents to determine the farmland rent each year. Column 7 starts with the average rent $127 in 2003 and then multiplies this by the corn and soybean price change (17.26%) to determine a rental rate of $148.93 for 2004. To determine the 2005 rental rate, start with the 2004 rate of $148.93 and multiply this by the price change (-25.28) and to determine an average rent of $111.28 for 2005. This process was repeated to determine rentals rate through 2018.
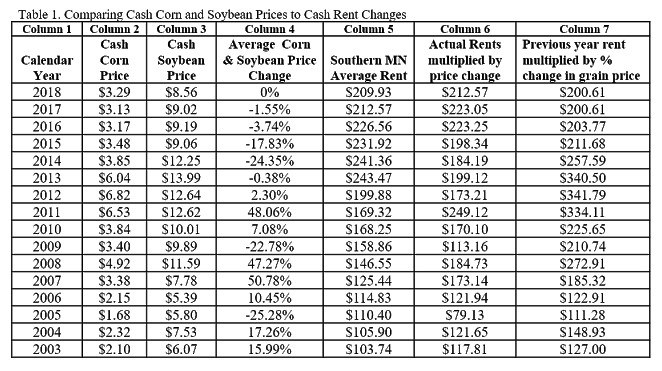
The last three columns vary quite significantly. If the change in corn and soybean prices was the main factor determining Southern Minnesota farmland rental rates, you would expect actual rental rates to be similar to Column 6. Comparing these figures the estimated rents using the price change factor were $171.53 lower than the actual rents listed in Column 5 which averaged $173.06 over sixteen years or an average of $1.53 per acre per year, very close. Using the second calculation of starting with a base rent in 2000 average ($98.31) (not shown) and adding or subtracting the price change each year to the previous calculation, there is much more variability and with calculated rents in Column 7 were higher averaging $218.46 over the sixteen years or $45.40 per acre per year, a significant difference. This more reactive rate is closer to what was called “the coffee shop rates”.
Rent had been on a steady increasing trend of less than $10 per from 2000 through 2005 then started increasing more rapidly from 2006 through 2010 and then increased only slightly in 2011 due to lower prices in 2009 and 2010, with $6.00 plus corn and $12.00 plus soybean prices, rents took off in 2012 and 2013 before beginning to decline in 2014 as corn and soybean prices moved lower.
Many factors effect rental rates including property taxes, input costs, yields, prices and gross income, but there does seem to be a relatively close tie to corn and soybean prices and southern Minnesota farm land rental rates.