By Angie Peltier

According to the U.S. Drought Monitor's June 14 report, the Northwestern Illinois Agricultural Research and Demonstration Center (NWIARDC) outside of Monmouth is part of the 36 percent of Illinois that is considered abnormally dry (Figure). This is the designation that is typically precedes a drought declaration.
The below average rainfall totals and above average high and low temperatures along with continued and increasing crop demand have combined to result in these abnormally dry conditions.
June 1 through June 20, 2016: Soil moisture. Soil moisture is measure by the Illinois State Water Survey's (ISWS) Water and Atmospheric Resources Monitoring (WARM) program at the NWIARDC at 2, 4, 8, 20, 40 and 60 inch depths under bare soil. They present soil moisture data in water fraction by volume (wfv) units, which can be better understood by comparing values to the field capacity and wilting point associated with the soil type.
According to the ISWS,
"Field capacity is roughly defined as the amount of water a soil can hold before draining. At field capacity, the pores of the soil contain both air and water. It is not the same as saturation in which the soil's pores are completely filled with water.
The wilting point refers to when a soil dries to a point that it is difficult for plants to extract water and so the plants wilt. The soil still contains moisture in its smallest pores, but plants are unable to access it.
The difference between the soil's field capacity and wilting point is considered the plant water available. The closer the soil moisture value is to field capacity, the more water is available for plant use. The closer the value is to the wilting point, the less water is available."
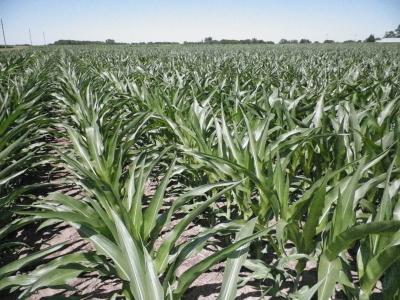
At the NWIARDC, the silt loam soils have a field capacity of 0.36 wfv and a wilting point of 0.14 wfv. Plotting the soil moisture values at 2 and 4 inches under bare soil shows how close the soils are to the wilting point (Figure). We are seeing stressed corn plants in those fields that were planted later in May. The root systems of these plants are likely not as well developed as those planted earlier and would therefore not be as able to access water and nutrients further down in the soil profile (Figure).
June 1 through June 20, 2016: Air temperature. One can compare the daily average high and low temperatures for the first 20 days of June, 2016 to the same time period of the previous 10 years and the 30-year normal temperatures for June (Figure). During this period 2016 has had hotter average high temperatures than both the 30-year normal and any of the past 10 years. The average daily low temperatures during this period were hotter than the 30-year normal, but were lower than the same period in 2010.
Regardless of how 2016 compares to other recent years, we could sure use some rain.
Source:illinois.edu