By Virginia A. Ishler
Production perspective
Even before the pandemic hit, the dairy industry had been experiencing wide swings in milk and feed prices. This volatility makes maintaining a breakeven cost of production difficult. Unlike other businesses where increased costs can be transferred to the customer, the dairy producer does not have that option. The other more significant challenge is the disappearance of the cyclic nature of the markets. In the past, producers could expect a strong milk price every three years. It has been seven years since the dairy industry has experienced a competitive milk price to combat the ever-increasing costs. Is maintaining the status quo on animal performance adequate to sustain a dairy operation in these difficult times?
Using the Penn State dairy herd as the model, their milk price is recorded monthly and used in calculating income over feed costs for "Dairy Sense". Rations and average production are consistent throughout the year. Milk production averages 83 pounds for a 2x milking herd, which meets that production benchmark. Utilizing the Penn State Feed Price List, monthly feed costs per animal group are determined. Using this approach, Table 1 illustrates annual milk income and total feed expenditures for the past five years. The difference is what covers all other direct, overhead, debt, and family living expenses. The last two years are showing a deficit of over $140,000 compared to 2017. For dairy operations that rely heavily on milk income to cash flow, this illustration does not paint a pretty picture. Even for the operation where the herd performance and rations are consistent, the milk and feed prices can create an unsustainable business. Unfortunately incorporating additional income and increasing herd size or acreage are not always viable options. The good news is that milk price is increasing, and feed costs are decreasing as 2021 comes to an end.
The stark reality of "business as usual" is not going to work if dairy operations are to survive. Strategies to improve animal performance and evaluate rations for all animal groups needs to be an ongoing practice. The bar must be set higher and higher if an operation wants to maintain a competitive cost of production. It still comes down to knowing your numbers and making decisions on fact, not fiction.
Table 1. Dairy Sense milk and feed prices for 2017 through 2021 with the same average milk production/year.1
| Year | Milk Price per cwt | Milk Income per cow | Total milk income per year | 210 milk cows feed cost/year | 45 dry cows
feed cost/year | 230 heifers feed cost/year | Total Feed Costs | Total milk income minus total feed costs |
|---|
| 2021 | $19.11 | $15.86 | $1,215,769 | $572,576 | $55,845 | $142,032 | $770,453 | $445,316 |
| 2020 | $17.93 | $14.88 | $1,140,698 | $516,621 | $60,608 | $146,073 | $723,302 | $417,395 |
| 2019 | $18.79 | $15.60 | $1,195,410 | $473,697 | $53,546 | $130,962 | $658,205 | $537,206 |
| 2018 | $17.13 | $14.22 | $1,089,802 | $416,210 | $45,497 | $115,012 | $576,718 | $513,084 |
| 2017 | $18.26 | $15.16 | $1,161,692 | $421,575 | $45,497 | $113,333 | $580,405 | $581,287 |
1Cow numbers reflect a herd milking 210 cows with an average milk production of 83 pounds milking 2x.
Note: The 2021 milk price was estimated from the futures markets for December. Total feed costs include expenses associated with home-raised and purchased feeds.
Economic perspective
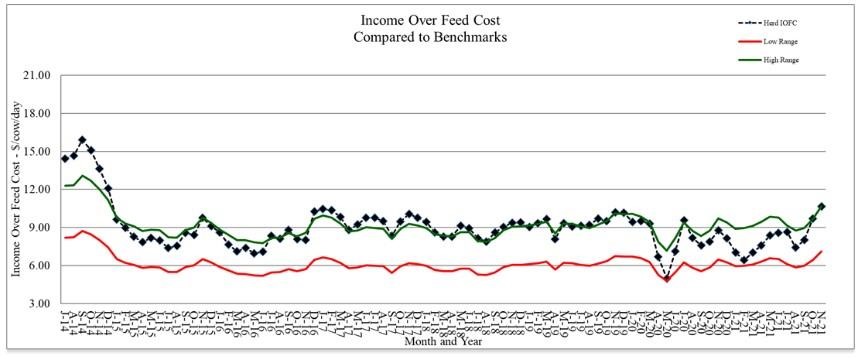
Monitoring must include an economic component to determine if a management strategy is working or not. For the lactating cows, income over feed cost is a good way to check that feed costs are in line for the level of milk production. Starting with July 2014's milk price, income over feed cost was calculated using average intake and production for the last six years from the Penn State dairy herd. The ration contained 63% forage consisting of corn silage, haylage, and hay. The concentrate portion included corn grain, candy meal, sugar, canola meal, roasted soybeans, Optigen, and a mineral vitamin mix. All market prices were used.
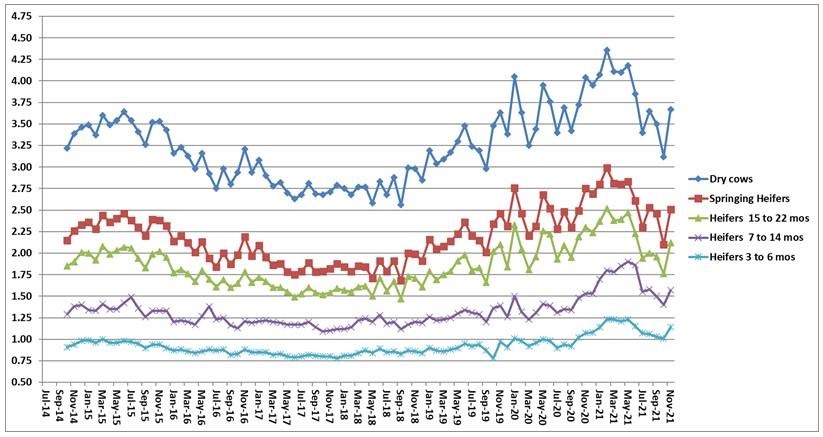
Also included are the feed costs for dry cows, springing heifers, pregnant heifers, and growing heifers. The rations reflect what has been fed to these animal groups at the Penn State dairy herd. All market prices were used.
Income over feed cost using standardized rations and production data from the Penn State dairy herd.

Note: November's Penn State milk price: $21.43/cwt; feed cost/cow: $7.13; average milk production: 83 lbs.
Feed cost/non-lactating animal/day.

Source : psu.edu