By Gary Schnitkey
Department of Agricultural and Consumer Economics
University of Illinois
By Carl Zulauf
As of middle June, much of the Midwest is either dry or in drought according to the U.S. Drought Monitor, raising the prospects of a serious drought like that which occurred in 2012. While a higher risk may exist in 2023 than in most years, a continuing drought and lower yields is not a foregone conclusion. However, farmer decision-making becomes more difficult as dry weather continues. Still, even if a drought occurs in 2023, net farm incomes for grain farms may not be low.
Dry Weather
Little rain has fallen over much of the Midwest since the beginning of May, resulting in most of the region being classified as abnormally dry or in a drought, according to the U.S. Drought Monitor. The June 13th Drought Monitor map shows the continuing drought in the Great Plains, with portions of Nebraska and Kansas being classified as in the two highest drought categories: extreme drought (D3) and exceptional drought (D4). From the Great Plains, dry conditions continue through the Midwest to the Atlantic Seaboard (see Figure 1). Most land is classified as dry or in drought in Iowa, Missouri, Wisconsin, Illinois, Michigan, Indiana, and Ohio, continuing into New York and Pennsylvania.

Some relief occurred over the weekend as rains fell over central Iowa. The National Weather Service (NWS) reported over an inch of rain in some parts of central Iowa. If the associated weather did not cause crop damage, this rain is welcome and will provide much-needed relief. Still, even with this rain, Iowa has below average rainfall during the last thirty days (May 23 to June 18), with some areas having 30-day departures of two inches or more (see Figure 2). The most significant departures occur in a geographical area centered in eastern Iowa, southeast Minnesota, southwest Wisconsin, western Illinois, and northeast Missouri (see Figure 2). Most of these areas have three inches below average, with some areas having 4 inches below normal rainfall.

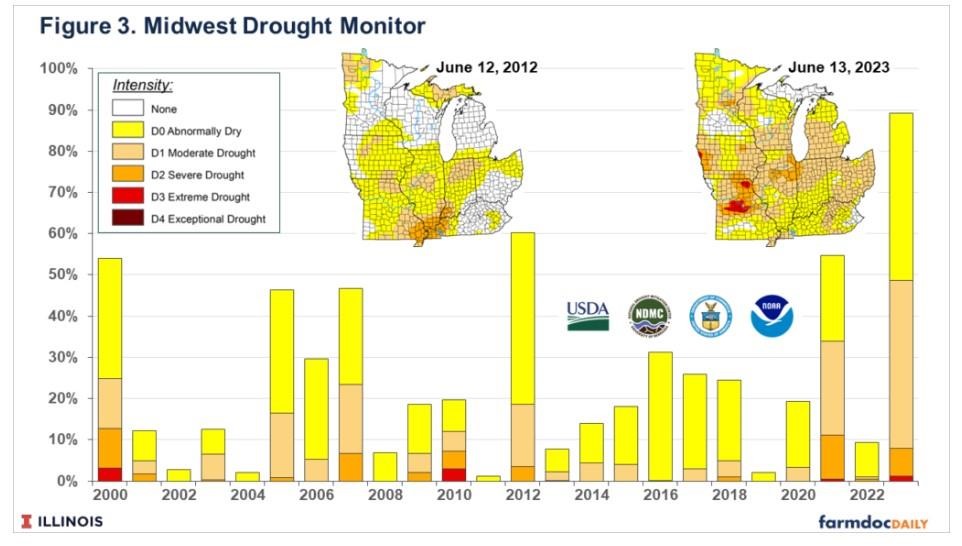
The U.S. Drought Monitor provides time series of statistics for various geographical regions. We obtained data for mid-June to see the severity of 2023 compared to other years. We choose the Midwest region, which includes nine states from Minnesota in the northwest to Missouri in the southwest over to Michigan, Ohio, and Kentucky in the east (see Figure 3). These eight states have produced 64% of corn in the U.S. over the past five years. The Midwest state rank is:
- Iowa (17% of U.S. corn production),
- Illinois (15%),
- Minnesota (10%),
- Indiana (7%),
- Ohio (4%),
- Wisconsin (4%),
- Missouri (4%),
- Michigan (2%), and
- Kentucky (2%).

States immediately west of the Drought Monitor’s Midwest region also are significant producers of corn: Nebraska (12%), Kansas (5%), South Dakota (5%), and North Dakota (3%). Nebraska, Kansas, and South Dakota are dry.
The Midwest states also produce 64% of the soybeans in the United States:
- Illinois (15% of U.S. soybean production),
- Iowa (13%),
- Minnesota (8%),
- Indiana (8%),
- Missouri (6%),
- Ohio (6%),
- Wisconsin (2%),
- Michigan (2%), and
- Kentucky (2%).
States immediately west of the Drought Monitor’s Midwest region also are significant producers of soybeans: Nebraska (7%), South Dakota (5%), North Dakota (5%), and Kansas (4%).
On June 13, 890% of the Midwest region was dry:
- 41% was abnormally dry (D1).
- 41% was in moderate drought (D2).
- 7% was in severe drought (D2).
- 1% was in extreme drought (D3).
The 90% classified as abnormally dry or worse for 2023 is the highest percentage since 2000, the first year the U.S. Drought Monitor has statistics available (see Figure 3). The next highest year is 2012 — the worst drought year from 2000 to 2022 — with 60% of land either dry or in drought.
Moving Forward
Mid-June dryness and drought can lead to a widespread drought like in 2012, resulting in large yield losses. However, the possibility of large yield losses is not a foregone conclusion. Any rain between now and early July could mitigate current dry conditions.
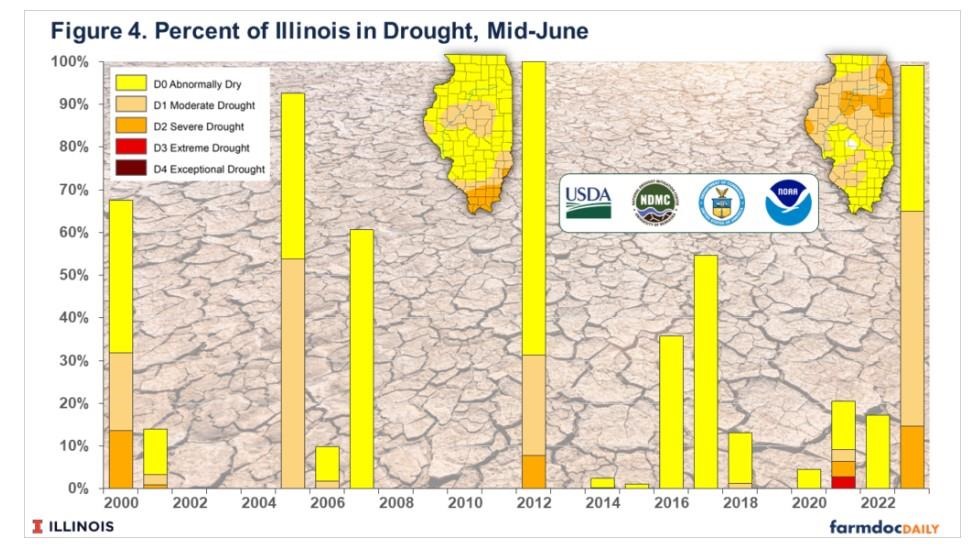
To illustrate, we related the mid-June percentages of land dry or in drought to state corn and soybean yields in Illinois and Iowa. Figure 4 shows the percentage of dry and drought land in mid-June for Illinois. In 2023, 99% of Illinois is dry or in drought, a very high rate. In 2012, 100% of Illinois was classified as dry or in drought. In 2012, corn yields averaged 105 bushels per acre, 63 bushels lower than the previous five-year average of 168 bushels per acre. In 2005, 93% of Illinois was classified as dry or in drought, and corn yields averaged 143 bushels in Illinois, down 13 bushels from the previous five-year average of 156 bushels per acre. In 2000, 67% of acres were dry or in drought. In 2000, Illinois had an excellent yielding year with a 151-bushel average, 19 bushels above the previous five-year average of 131 bushels.

Our analysis had Illinois and Iowa state yields in a regression as dependent variables with explanatory variables of 1) a yield trend and 2) percent dry or in drought in mid-June. From a statistical standpoint, the percent dry or drought in mid-June did not explain corn or soybean yields in Illinois or Iowa.
The critical period for determining corn yields is pollination, which will occur in early to mid-July. Any rains that occur between now and then could elevate dry conditions and result in trend or above-average yields. Temperatures could play a role, with lower temperatures being preferred in dry conditions. For soybeans, the critical weather period is longer. A dry early July — if it occurs — could be offset by rains in later July or August.
As of June 20th, forecasts do not suggest much rain in most of the Midwest through Sunday, June 25. Predictions are for no rain in Illinois, with some rain projected for Ohio. If no precipitation occurs until June 25, the weather during the last week of June and July will become even more critical.
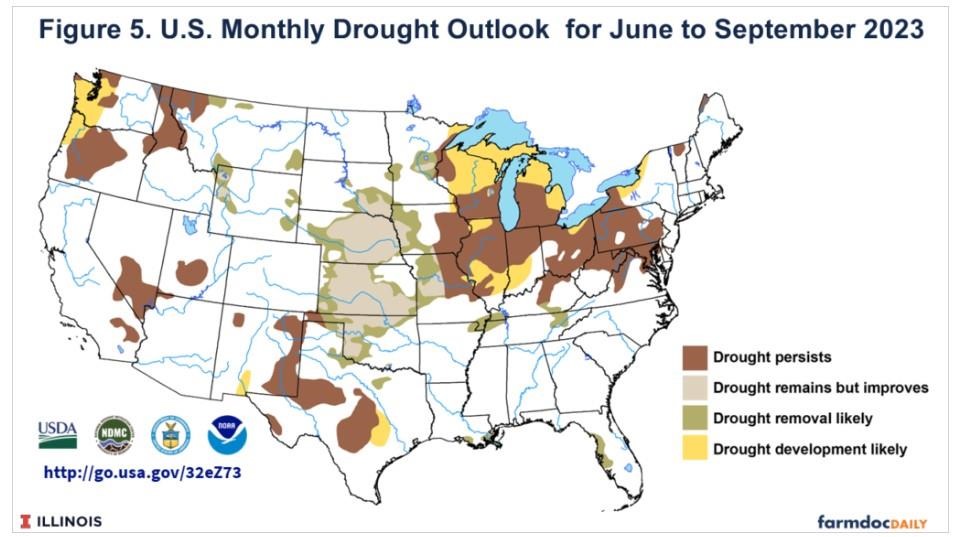
At this point, yield shortfalls from drought are not a foregone conclusion, but the risks are much higher in 2023 than in most years. Currently, it seems improbable that a large weather system will blanket the entire Midwest with rain. As a result, some areas likely will remain in a drought. Northern and central Illinois are particularly at risk since this area has less rain than other areas, and forecasts are pessimistic concerning rain (see Figure 5).

Price Reactions
Both corn and soybean prices have rebounded in recent weeks, likely on the potential of lower yields. The December 2023 corn futures contract on the Chicago Mercantile Exchange (CME) was near $5.00 per bushel in mid-May 2023, increasing to $5.50 on June 14. From the $5.50 level, the corn price shot up to $5.97 on June 16. The $5.97 is $.06 higher than the $5.91 projected price for crop insurance purposes in 2023.
The November 2023 CME soybean contract was $11.45 per bushel at the beginning of June 2023. From the $11.45 level, soybean prices increased to $13.42 on June 15. The $13.42 price is $.34 below the 2023 projected price of $13.76.
Typically, prices continue to rise in drought years. Price increases will depend on the size of reduced yields, and the most impacted geographical areas. Since Illinois and Iowa are large producers of both corn and soybean, drought impacted yields in those two states will have more pronounced price impacts than other areas. A widespread drought can have large price impacts. In 2012, for example, the projected price for corn was $5.68 per bushel, and the harvest price was 32% higher at $7.50 per bushel. Soybean prices rose from a projected price of $12.55 to a harvest price of $15.30, an increase of 23%. Similar increases are likely in 2023 if dry weather continues across much of the Midwest. A 32% increase in corn results in a projected price of $7.80. Of course, a widespread rain system across the Midwest could lead to higher expectations of yields and price declines from current levels.
Farmer Decisions
At this point, the decisions that farmers need to make will become more difficult. For example, any late-planned applications of nitrogen on corn become questionable. Moreover, decisions on herbicide and insecticide spray to counter any unexpected pest problems become more complex. Double-cropping soybeans in dry soils after wheat may not be warranted. Marketing decisions also become more difficult as there is considerable price uncertainty. A continuation of dry conditions likely will lead to price increases, while large-scale rains could lead to price reductions. Large sales of new crop currently seem risky at this point.
Fortunately, most farmers purchase crop insurance with a guarantee increase, with Revenue Protection (RP) being the most used crop insurance plan. RP’s guaranteed increase that is particularly useful in drought years. RP’s guarantee is:
The higher of the projected or harvest price (for guarantee purposes, the harvest price is capped at two times the projected price)
x guarantee yield (either the actual production history (APH) yield or the Trend-Adjusted production history yield)
x coverage level
As illustrated above, a continuation of the drought likely will lead to harvest prices above projected prices ($5.91 for corn and $13.76 for soybeans). In 2012, the guarantee increase played a key role in large crop insurance payments.
A reduction in net income is not a foregone conclusion even if a widespread drought occurs, particularly for those farmers who purchased crop insurance. In Illinois, the 2012 drought year was a record income year up to that point (see farmdoc Daily, November 15, 2022). Drought conditions could result in rising prices. Those rising prices will increase revenues on grain that is produced. Crop insurance could fill gaps, particularly if harvest prices are above projected prices. Moreover, a large drought could prompt the continuation of disaster assistance programs like we have seen in recent years through the Wildfire and Hurricane Indemnity Program (WHIP), WHIP plus, and the Emergency Relief Program (ERP).
Moreover, a large-scale 2023 drought could delay a return to lower prices in the future. Corn and soybean prices were expected to fall this year with normal yields. And, up until late May and early June, new crop bids were declining. The potential of a large-scale drought has brought this decline to an end. A continuation of dry conditions could push price declines into 2024 or beyond.
Summary
Mid-June conditions raise the prospect of a large-scale drought over much of the corn and soybean-producing areas of the United States. While risks are large, drought-reduced yields are not a foregone conclusion. Much attention will be given to actual and forecast weather over the next several weeks.
Farmer decisions become more challenging during a drought. Even given a drought, lower incomes are not a foregone conclusion. A combination of higher prices, crop insurance payments, and disaster payments could at least partially offset losses and still result in relatively good income levels for grain farms in 2023.
Source : illinois.edu