By Paul D.Esker and Alyssa Collins et.al.
This article is this week’s
Agronomy Highlight for
Monday, 6/15 at 8:00am. The Agronomy Highlight is an opportunity to ask the authors questions and get updates from around the commonwealth. Fill out the
survey to ask a question about this article before the Agronomy Highlight discussion.
You can join us on
zoom or by calling +1 646 876 9923, and when prompted enter the webinar ID: 210 945 454. The discussion will also be live-streamed Mondays at 8:00 am and stored for later viewing on the
Field and Forage Crops Facebook page.
Earlier this year , we discussed the decision-making process to help decide if a foliar fungicide would be warranted for small grains like barley and wheat. Now that we have passed flowering in many areas of the state, this is the time to start to think about how to evaluate the efficacy of any fungicide treatments, as well as determine what might be the potential impact of any disease on final yield. This is especially important, not only for Fusarium Head Blight (FHB) but also for important foliar diseases like rusts and powdery mildew. Also, with the spring conditions that our small grains faced this year, we saw an increase in leaves and heads damaged due to low temperatures and frost (Figure 1).
Figure 1. Frost damage and symptoms and signs of leaf rust and powdery mildew in non-sprayed malting barley (Photo credit: A. Murillo Williams, Penn State Extension).
As we wrote in our earlier article, we recommend scouting and assessing multiple areas of the field (minimum of 10 locations) wherein each location, we examine 10 randomly selected plants. We recommend that you use one of the following patterns: “zig-zag”, “diamond-shaped”, “X-shaped”, or “W-shaped” to get around the field to make your assessments.
Final yield in small grains is a function of the relative contribution of different leaves, the leaf sheath, and the wheat ear (or head). In Figure 2, the relative contribution of the primary components is provided, which can use be used to prioritize where assessments are obtained. We can see for both wheat and barley that the upper part of the plant (flag leaf and higher) contributes approximately 50 to 65% to final yield. Depending on the small grain species, we often start there with our assessments, but for crops like barley, the leaf below the flag leaf actually adds another 20-40% to final yield, which is important to take into consideration as sample and estimate the impact of foliar diseases.
Figure 2. The relative contribution to yield of different plant parts in wheat and barley (Adapted from the Foundation for Arable Research, 2009; Photo credit: A. Murillo-Williams, Penn State Extension).
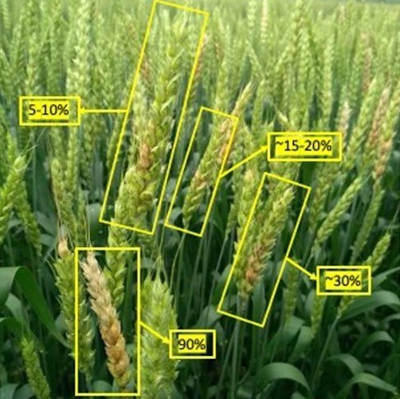
Assessing Fusarium head blight in the field: One of the challenges in assessing FHB is to take a reliable assessment of disease intensity. Three different measures are often commonly used: (1) disease incidence, (2) disease severity, and (3) FHB index. Each of these measures tells us something about the overall impact of FHB. Disease incidence is simply the number of FHB infected ears divided by the total of number of ears assessed multiplied by 100 to get a percentage. For example, if you assess 100 ears and find that 50 of those have FHB symptoms, the incidence would be 50%. Disease severity is a measure of the number of spikelets that have FHB. As we highlight in Figure 3 for several different examples, it is very easy to find ears that have no FHB (disease severity = 0%) to 100% of the spikelets infected. By assessing at least 100 ears from different locations in the field, this should provide for a reliable estimate of the overall disease severity. Lastly, it is very common to see reported in variety and fungicide tests the FHB index, which takes into account both the disease incidence and disease severity. To calculate this value, you multiply disease incidence by disease severity, which is then divided by 100 to give a final value that ranges from 0 to 100. For example, if we had 50% disease incidence and 25% disease severity, the FHB index would be: (50*25)/100 = 12.5. FHB index values of 10 or greater are often considered high.

Figure 3. Examples of Fusarium head blight infected heads showing different levels of disease severity (Photo credit: P. Esker, Penn State Extension)
Diseases that could be confused with FHB are glume blotch and black chaff. However, both diseases will lead to darkening of the glumes rather than the typical bleaching observed in FHB and will not produce the scabby/tombstone grains. For more details on these diseases, visit
Crop Protection Network.
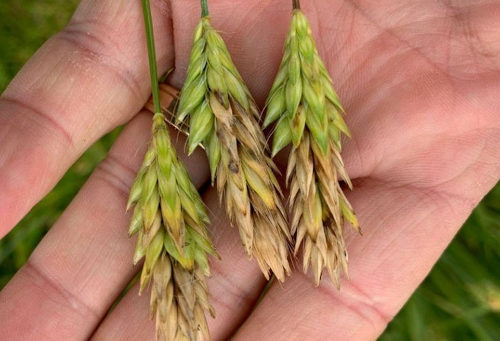
Also leading to confusion this season may be damage to heads resulting from late freeze events, which can produce symptoms similar to those of FHB. Figures 1 and 4 show the spikelet darkening many have observed on barley in central Pennsylvania this spring. Compare this to an image of FHB symptoms on barley in Figure 5, and you will see these heads are visually identical. Both can cause water-soaking and discoloration of entire sections of the spikelet and prevent normal development of the kernel. How, then, do we determine the root cause of our head damage? One way is to take note of the timing of events in relation to the growth stage of the crop. Frost damage will likely be observable within a week of the cold event. It may also be accompanied by twisting and deformation of the heads as they continue to emerge. FHB symptoms, on the other hand, will not be visible until about three weeks after flowering (or head emergence in the case of barley). Another clue is the fuzzy growth (mycelium) which can be seen in Figure 6. A light pink, purple or orange color and fuzziness of the glume may develop with moist environmental conditions on FHB-affected heads. If a positive identification is desired, Pennsylvania farmers can send samples to the
Penn State Plant Disease Clinic.

Figure 4. Cold temperature damage on barley (Photo credit: J. Graybill, Penn State Extension)
Figure 5. FHB symptoms on barley (Photo credit: A. Collins, Penn State Extension)
Figure 6. Advanced FHB on barley, showing fungal mycelium (Photo credit: A. Collins, Penn State Extension)
Source : psu.edu