By Jay Parsons and John Hewlett et.al

Risk strategies are often a complex sequence of decisions completed over a period of time with new information collected along the way. A decision tree or decision flow diagram is a very useful tool in that it can provide a clear graphical representation of these risky decision problems.
Decision Trees
Constructing a decision tree requires the decision maker to identify the relevant courses of action, the important chance events, and potential outcomes in the order they are expected to occur through time. The thought process followed when constructing the decision tree is at least as valuable as the tree itself. It forces the decision maker to think through a road map for the future that is summarized by branch points where the decision maker can either exercise control over the direction taken or where chance events may occur.
Representing Decisions
Decision trees use standard symbols to represent forks in the road based on control. A small square or rectangle is used to designate a decision node or juncture where a decision maker is in control. A small circle is used to designate a chance event node where chance will determine the path that is taken.
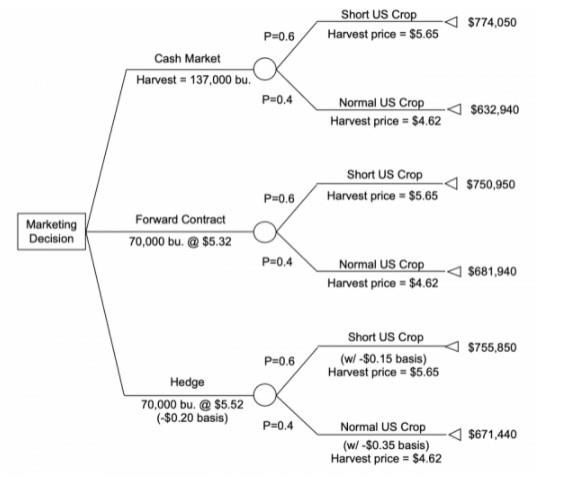
Figure 1 presents a simple decision tree with a single corn crop marketing decision followed by two possible event outcomes. The marketing decision involves three possible courses of action including selling on the cash market at harvest, forward contracting a little over half of the expected sales for delivery at the local elevator, and hedging a little over half of the expected sales on the Chicago Board of Trade. The chance event is summarized as a short crop/favorable market outcome where production on a national level is less than expected, typically leading to an increase in price. The alternative is a normal crop/unfavorable market outcome with associated probabilities of occurrence of 60 percent and 40 percent, respectively. Expected sales and prices can then be used to calculate marketing revenue for each decision under each market outcome scenario.
For example, if a short crop occurs and markets are favorable, the decision to sell on the cash market at harvest would net the highest revenue at $774,050. Meanwhile, if a normal crop occurs and markets are unfavorable, the decision to forward contract over half the expected sales for delivery at the local elevator would net the highest revenue at $681,940. In reality, the decision maker will make the decision before the chance event outcome is known. The decision tree helps clarify this to the decision maker and shows the decision is really about deciding which risky gamble to take with the future event outcome.
Complex Strategies
Most decision problems involve many more choices and possible outcomes than those depicted in Figure 1. However, the attempt to construct a decision tree representing a series of risky decisions forces the decision maker to define specific choices they are considering and to mull over the possible outcomes that could occur. Even though the decision tree may never fully represent the complexity of the decision problem, the process of putting it together will usually be a tremendous help to the decision maker in clarifying the analysis.
Constructing a decision tree forces the decision maker to think through a road map of decisions and events that eventually lead to outcomes. Real decision problems can quickly become a complex mess if an attempt is made to put all of the details into a single decision tree. A useful first step in constructing a decision tree is to construct an outline of the important choice and event nodes under consideration.
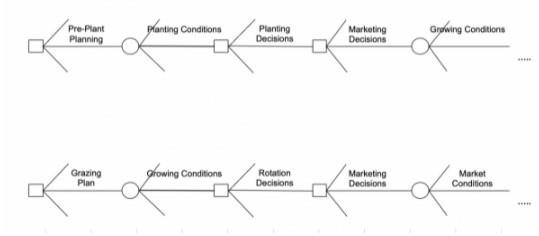
Figure 2 illustrates example decision tree outlines for a corn farmer and a cattle rancher. For example, a corn farmer must first make a series of pre-plant decisions such as crop insurance coverage, pre-purchase of supplies, etc., summarized in the outline as pre-plant planning. This is followed by weather and market events, outside the farmer’s control, that result in planting condition outcomes. The farmer then must make planting decisions given the information. The process continues with various important decision points occurring during the production and marketing year along with important chance event outcomes being revealed that can inform those decisions. Details can be added to the outline structure as needed to help clarify the information available and inform the decision maker.
Decision Sequence
Understanding decisions that need to be made today, decisions that can be made later, and the linkages between the two, reveals a lot about the decision context. For example, a rancher might draft a drought management plan to address the possibility of extremely dry weather. Stocking decisions are influenced by the animals available, expected forage availability and market conditions, among other things. The decision to not turn-out all available animals to pasture would trigger a subsequent decision about what to do with the remaining animals. Likewise, a decision to stock with a few more animals than usual may trigger a subsequent decision about what animals to add to the grazing herd and how to acquire them. Subsequent stocking rate adjustments may be needed and trigger even more decisions as conditions unfold over the grazing season. In addition, strategies that include decisions to stockpile hay likely should be considered before the grazing season begins. These decisions, like the pre-plant decisions for a corn farmer, can have a profound impact on the subsequent decisions and possible outcomes.
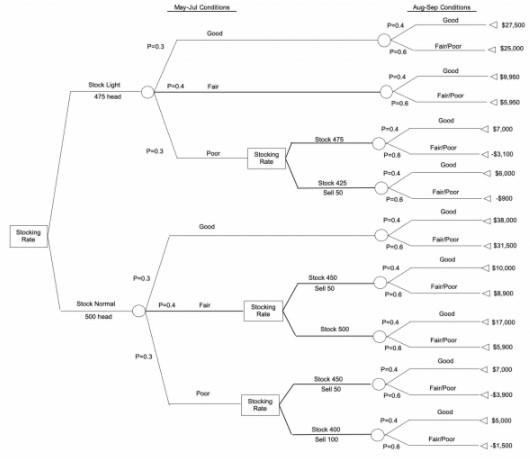
Figure 3 depicts a very simple stocking rate decision for a rancher running yearly calves. The initial stocking rate decision is followed by the early season growing conditions chance event that may result in good, fair, or poor conditions. A subsequent decision to partially de-stock is followed by a late season growing conditions chance event and possible outcomes. These estimates and calculations should be adjusted as more certain information becomes available over the course of the year.
Decision trees are just one way to represent decision choices involving risk. While they can get quickly become complicated, the process of putting together a decision tree forces the decision maker to think through important elements to consider, including: chance events, decision points, outcomes, and timing. The process of mapping these details provides value and insight that leads to greater clarity about the key decision elements.
Figure 1: Example Decision Tree for Corn Farmer Marketing Decision

Figure 2: Example Decision Tree Outlines for a Corn Farmer and Cattle Rancher.

Figure 3: Example Decision Tree for Ranch Stocking Decision
 John Hewlett, Ranch/Farm Management Specialist - University of Wyoming Jay Parsons, Risk Management Specialist - University of Nebraska-Lincoln Jeff Tranel, Ag and Business Management Specialist - Colorado State University
Source : unl.edu