By Pat Hoffman
Introduction
The practice of forage sampling and analysis has long been the foundation for dairy nutrition consulting and ration formulation. As the forage and dairy production industries have evolved, forage sampling/analysis has become integral not only for ration formulation, but also for forage contracting, pricing and inventory control programs used by dairy producers and their consultants. Because forage quality plays such a critical role on modern dairy farms, the traditional forage sampling and analysis guidelines may not be adequate. The aim of this Focus on Forage article is to re-think forage sampling and analysis guidelines for dairy farms in a question/answer format. For more general background information, readers are referred to “Sampling hay, silage and total mixed rations for analysis” (UW Extension Publ. A2309; http://learningstore.uwex.edu/assets/pdfs/A2309.pdf).
How frequently should the dry matter (DM) content of silages be determined on the farm?
The DM content of silages and wet by-product feeds must be determined to calculate the as-fed amounts of these ingredients to add to the TMR to ensure that the desired amount of DM is being fed in the ration. Because feeding the proper amount of DM of each feed ingredient in the ration is so important, it is recommended that the DM content of silages be determined as frequently as possible. Many farms adopt 1x to 3x per week forage DM evaluation protocols to ensure that the proper of amount of silage DM is fed in the ration. In most instances, weekly or batch sampling of wet by-product feeds for DM determination is adequate. In addition, when a change in silage moisture content is noticeable by sight or touch, the DM content of the silage or by-product feed should be re-determined immediately.
There are some circumstances that may require altering the basic silage or by-product feed DM monitoring plan listed above. For example, in bunker silos the silage DM monitoring program is dependent on the variation in DM content at filling, removal rate and whether or not a facer is used to remove the silage. With minimal variation in DM content at filling (i.e. Corn silage), fast removal rates and facer removal, the DM content during feed-out is often less variable because DM contents (i.e. varying harvest and drying conditions) are better represented horizontally and vertically along the face of the bunker silo. With highly variable DM contents at harvest (i.e. legume or legume-grass silages), slow removal rates and unloader removal, the silage DM content during feed-out can be highly variable. As a result, silage DM monitoring programs may need to be intensified depending on the forage and how the silage is removed.

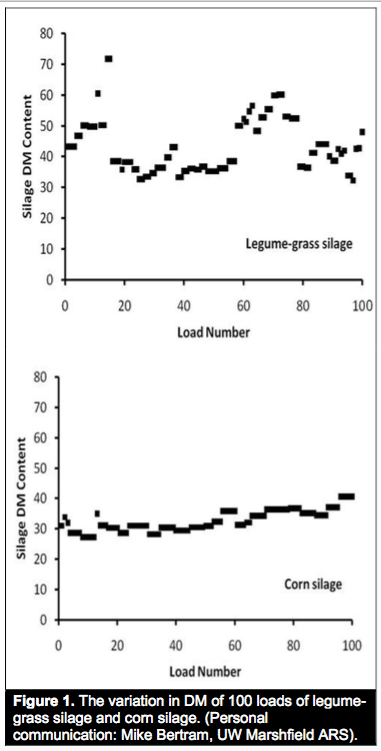
Another consideration is monitoring the DM content of silages stored in silo bags. Often a set weekly DM monitoring program that works well for corn silage stored in bags does not work well for legume, legume-grass or grass silages stored in silo bags, because silages stored in bags are removed exactly as filled; load to load, field to field, or cutting to cutting with the variation in DM content at filling re-presenting during feed-out. This concept is defined in Figure 1 where the variation in DM content of 100 loads each of legume-grass silage and corn silage are plotted to demonstrate the greater load to load variation in DM content for legume-grass silage than corn silage. When legume or legume-grass silages are stored in silo bags it is often a better to determine the DM content of silages when filling the silo and marking the bags by load, field, or cutting so that rapid changes in silage DM content can be anticipated. This approach can work for other nutrients (i.e. CP, NDF, etc.) as well. Another simple procedure to determine DM content of silages in bags or tower silos that are highly variable in DM content is to use a food dehydrator and placing a silage sample in the dehydrator after feeding. The dehydrator will dry the forage slowly overnight and the forage DM content can be determined the following day immediately before feeding. For more information on measuring forage DM content with a food dehydrator refer to: http://fyi.uwex.edu/forage/files/2014/01/DM_using_dehydrator_Final.pdf
How frequently should forages be sampled for analysis for nutrient composition at a commercial feed testing laboratory?
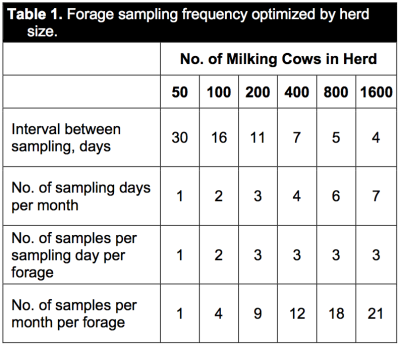
Evaluation of forage quality has traditionally been done by monthly sampling of the forages being fed and sending the samples to a feed and forage testing laboratory for determination of nutrient composition. However, this sampling protocol may be inadequate on larger dairy farms. Researchers at The Ohio State University now recommend different feed and forage sampling protocols depending upon herd size. An analysis was performed using their software program to generate the results provided in Tables 1 and 2. The optimum sampling frequency for herds ranging from 50 to 1600 milking cows is presented in Table 1. The optimum sampling schedule for the 50 cow herd was the same as what has been done traditionally in the dairy industry. As herd size increased from 50 to +1000 cows, the interval between sampling decreased from 30 to 4 days so that sampling was required on 7 days per month in the large herd instead of only one day monthly in the small herd. Additionally, the number of samples required per sampling day per forage was 1, 2 and 3 for 50, 100 and 200-1600 cow herds, respectively. Therefore, the number of samples required per month per forage increased from 1 to 21 as herd size increased from 50 to 1600 cows.

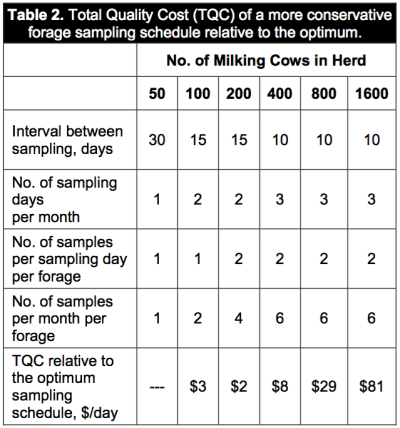
In anticipation of some large herds not wanting to adopt a more aggressive sampling schedule, the results from a comparison of a more conservative sampling schedule to the optimum is presented in Table 2. For large herds, the interval between sampling was set at 10 days so that the number of sampling days per month was limited to 3. The number of samples per sampling day per forage was limited to 2, thereby resulting in 6 samples per month per forage. The total quality cost (TQC) to the dairy herd for this more conservative sampling schedule relative to the optimum was $8, $29 and $81 per day; TQC includes the cost due to lost milk production if forage quality declines.

The amount of specific forage included in the ration and the potential nutrient content variation can also influence its sampling and analysis frequency. For example, if a dairy herd is feeding 20 lb. DM per cow per day from legume-grass silage, which has a more variable nutrient composition, then the silage should be tested frequently as variation in nutrient composition could have a large impact on the ration. In contrast, if a dairy herd is feeding 20 lb DM per cow per day of corn silage with low variation in nutrient composition then the silage can be tested less frequently. Likewise, if feeding 1 lb. of straw per cow per day the variation in the quality of straw would have minimal impact on the ration; thus, the straw can be tested less frequently. Dry hay or straw is best sampled and analyzed on a lot-to-lot or load-to-load basis. The process is different for silages because silo filling, unloading and feeding is a continuous or dynamic process, and silage sampling and analysis should likewise be continuous to determine or anticipate changes in nutrient composition over time.
How should new sample analysis results be used?
An intensive forage sampling program does not mean rations are automatically rebalanced every time a new silage or feed analysis are received from the feed and forage testing laboratory. Intensified silage sampling protocols are designed to quantify changes in forage quality as early as possible or during the period of change. If the new nutrient composition results change and there is a logical reason for the change (i.e. change in lot or load, field, cutting, variety, location within the silo, change of silo, etc.), then the new nutrient composition data likely better represents the forage in the current ration. In this case, the new data should be used for ration re-formulation.
If the change in the primary nutrient (CP, NDF, starch, etc) composition is small (<5.0% of the old value) then the change in nutrient composition may simply be due to random error related to sampling or laboratory analysis. In this case the new nutrient composition data should be averaged with the old nutrient composition data and the mean values used for the scheduled ration re-formulation.
Source:uwex.edu