By Brenna Ellison
Department of Agricultural and Consumer Economics
University of Illinois
The issue of food loss is a concern at all stages of the supply chain, in developed and developing countries. Many discussions on the issue open with a staggering statistic about the amount of food that is lost or wasted. While the number provided can vary widely based on how food loss is defined and the data used to measure it (for more, see discussions by Bellemare et al., 2017; Ellison, Muth, and Golan, 2019), it is common to start with an estimate of food loss by weight (in pounds or tons). In some cases, food loss may also be reported, or framed, in value (dollar) or calorie (kcal) equivalents. In this article, we discuss the potential implications of how an individual or entity chooses to frame food loss.
An Illustrative Example: The USDA Loss-Adjusted Food Availability (LAFA) Data Series
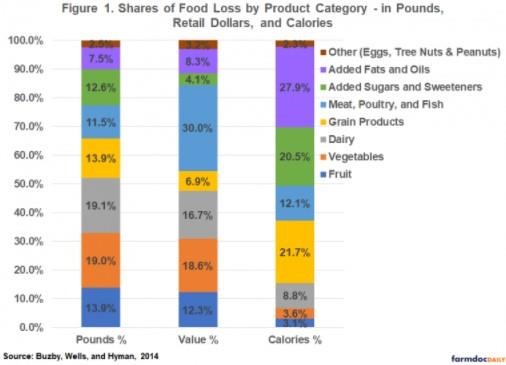
One of the most cited estimates of food loss in the U.S. is derived from the USDA LAFA data series. Using this data, Buzby, Wells, and Hyman (2014) estimated that, in 2010, 133 billion pounds of food (31% of available food supply) was lost at the retail and consumer levels. The authors then convert that Figure to retail dollar ($161.6 billion) and calorie (141 trillion) equivalents for the year. Notably, the report by Buzby, Wells, and Hyman (2014) is one of the few that has the capability of breaking these estimates down into product categories like fruits, vegetables, grains, dairy, etc. Figure 1 uses data from this report to show the breakdown of food loss shares by product category in weight (pounds), value (retail dollar), and calorie (kcal) equivalents.

From Figure 1, we can see that the first two columns (shares of food loss in pounds and dollar value) are comparable for most food product categories. One notable exception is the meat, poultry, and fish category, which makes up a much larger share of food loss when estimated in dollars (30%) vs. in pounds (11.5%). Conversely, grains and added sugars and sweeteners comprise larger shares of food loss when estimated in pounds compared to dollars (13.9% vs. 6.9% for grains; 12.6% vs. 4.1% for added sugars and sweeteners).
The third column in the chart, which presents shares of food loss in calorie equivalents, looks quite different from the first two. Whereas fruits and vegetables make up approximately 30% of food loss in pounds and dollars, the low-calorie nature of these foods mean they comprise a mere 6.7% of calories lost. Even more notable is the share of calories lost from added fats and oils and added sugars and sweeteners. Jointly, these two product categories account for almost half (48.4%) of calories lost. Grains also account for a more significant share of loss in calories than they do in pounds or dollars.
So What?
When we talk about the magnitude of food loss, how we present that information matters. If we present food loss in pounds or dollars, for example, our recommendations for policymakers may be very different than if we are talking about food loss in calories. Researchers and advocates should especially take caution when talking about food loss in calorie equivalents as a justification for food recovery efforts. Yes, 141 trillion calories lost per year (a per capita loss of 1,249 calories per day) is unthinkable, but the quality of those calories needs to be considered. Nearly half of calories lost come from calorically-dense yet nutrient-poor foods (added fats and oils, added sugars and sweeteners) that consumers are recommended to limit their intake of in the first place (Ellison and Prescott, 2021). Targeted food recovery efforts for nutrient-dense foods like fruits and vegetables are likely more desirable from a public health standpoint.
Source : illinois.edu