By Carl Zulauf
Department of Agricultural, Environmental and Development Economics
Ohio State University
Gary Schnitkey and Jonathan Coppess et.al
Department of Agricultural and Consumer Economics
University of Illinois
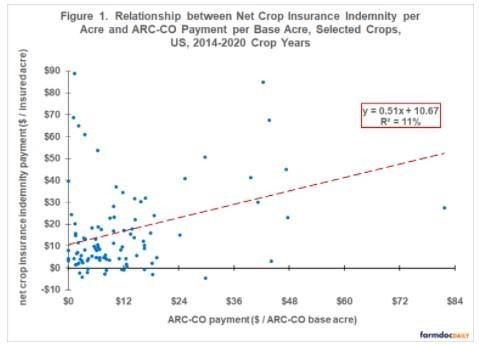
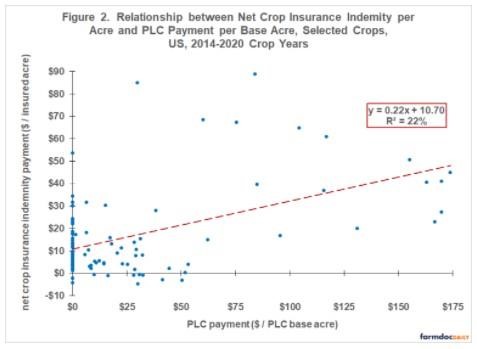
An issue in recent farm bills has been a concern that crop insurance and ARC-CO (Agriculture Risk Coverage – County commodity program) would make payments for the same loss. The analysis discussed in this article finds that, over the 2014-2020 crop years, ARC-CO payments to US farms explain only 11% of the variation in net crops insurance indemnities paid to US farms. Payments by PLC (Price Loss Coverage commodity program) explain a higher, but still low 22% of the variation in net indemnities. These findings suggest payments by crop insurance and ARC-CO / PLC for the same loss are likely not large at the US program level.
Different Policy Objectives: Crop insurance’s policy objective is to provide assistance for declines in yield or price over a crop’s production period. ARC-CO’s objective is to provide assistance when income is transitioning from a multiple-year period of high income to a period of low income. PLC’s objective is to provide assistance for low prices during a crop’s marketing year. For a more in-depth discussion of ARC-CO’s and PLC’s policy objectives, see the February 24, 2022 farmdoc daily article.
Different Program Design: Different policy objectives lead to different program design. Insurance assistance is based on market prices prior to planting and trend-adjusted historical yields for a crop year. ARC-CO assistance for a crop year is based on an Olympic average (removes high and low values) of trend-adjusted historical yields and of market prices over 5 crop years that proceed the prior crop year. For the 2021 crop year, the calculation window is the 2015-2019 crop years. PLC assistance for a crop year is based on a fixed yield set using a historical period, a statutory target price set by Congress, and a price escalator option (see Data Note 1). Actual values used for a crop year are price and yield at harvest for crop insurance, yield at harvest and market year price for ARC-CO, and market year price for PLC.
Relationship between Insurance and ARC-CO Payments: Payments are compared for covered program commodities that have an insurance contract (see Data Note 2) for the 2014-2020 crop years (years ARC-CO was authorized). There are 101 crop – crop year observations. For each observation, US ARC-CO payments after removing generic base acre payments (see Data Note 3) are divided by US ARC-CO base acres and US net crop insurance indemnities (indemnities minus farm-paid premiums) are divided by US insured acres. A positive relationship exists with 99% statistical confidence (see Figure 1). However, variation in ARC-CO payment per base acre explains only 11% of the variation in net indemnity per insured acre. Other variables explain 89%. Reasons for the low relationship include different price windows and types (harvest month prices for insurance vs. 5 historical market year prices for ARC-CO), individual farm yields (most insured acres) vs. county yields (ARC-CO), and payments on planted acres (insurance) vs. historical base acres (ACR-CO) that may also have different distributions across space.

Relationship between Insurance and PLC Payments: As with ACR-CO, a positive relationship with 99% statistical confidence exists between US PLC payment per US PLC base acre and US net crop insurance indemnity per US insured acre (see Figure 2). The variation in PLC payment per base acre explains 22% of the variation in net indemnity per insured acre. While explanation is two times greater for PLC than ARC-CO, other variables explain 78% of the variation in net indemnity payment per insured acre. Payment per acre by PLC and crop insurance can overlap when price declines during the growing season, leading to crop insurance payments, and a lower market year price, leading to PLC payments if price is below the reference price.

Sensitivity Analysis: Smaller acreage crops can have higher variability in program payments per acre, which may affect the estimated relationship. Thus, the relationships were estimated only for crops and years when insured acres exceeded 1 million (observations = 73). Explanation shares changed little: 9% vs. 11% for ARC-CO and 22% for PLC in both analyses.
Summary Observations
Concern exists that crop insurance and ARC-CO will make payments for the same loss.
If this overlap is substantial, variation in payments over time should be similar for the programs.
Using data at the US level for the 2014-2020 crop years, the variation in ARC-CO payment per ARC-CO base acre was positively related to the variation in crop insurance net indemnity payment per insured acre, but explained only 11% of the variation.
PLC payments per base acre explained a higher share of the variation in net crop insurance payment per insured acre, but it explained only 22% of the variation.
These findings suggest overlapping payment is likely not a substantive issue between crop insurance and either ARC-CO or PLC at the US program level.
This conclusion is not surprising since policy objectives and thus program design parameters differ materially for the different farm safety net programs.
Data Notes
- The escalator option means a covered commodity’s effective reference price equals the higher of (a) the statutory reference price set by Congress or (b) 85% of the Olympic average price for 5 prior crop years subject to a cap at 115% of the statutory reference price.
- Observations are barley, canola, corn, dry peas, mustard, oats, peanuts, rice, safflower, sesame, sorghum, soybeans, sunflowers, and wheat for the 2014-2020 crop years and upland cotton for the 2018-2020 crop years.
- Payments made to program commodities planted on generic base acres for the 2014-2017 crop years were, in effect, payments to upland cotton base acres, not to a program commodity base acres. Upland cotton was not a program commodity during these four crop years.
Source : illinois.edu