By KRISTEN FRENCH
Megafires, extreme weather, locust swarms, pandemics: These are just some of the many natural disasters that have devastated farmers in recent years, destroying livelihoods and leaving hunger in their wake. Between 2008 and 2018, disasters cost the agricultural sectors of developing countries over $108 billion in damaged or lost crop and livestock production, according to a recent report from the Food and Agriculture Organization of the United Nations.

Daniel Osgood, NSF grant recipient. Credit: Francesco Fiondella
To manage the risks of disasters, developing world farmers increasingly purchase index insurance, which pays out benefits according to a predetermined “index” or model, such as seasonal rainfall volume. When rainfall hits the preset level, it triggers a payout. But often, the index insurance models are at odds with the reality on the ground. The smallest errors in choice of satellite data can skew outputs and throw the payout system out of synch with the farmers’ actual needs. Ultimately, poorly designed index insurance can lead entire communities and countries into a false sense of security and result in both grave financial shortfalls and food shortages when climate disasters strike. It’s a problem that desperately needs a fix, especially as the frequency, extremity, and complexity of climate disasters grow due to climate change.
A National Science Foundation (NSF) grant to Columbia researchers Daniel Osgood, Eugene Wu and Lydia Chilton, announced September 1, comes just in time. The NSF allocated $600,000 to Osgood, of Columbia Climate School’s International Research Institute for Climate and Society, and Wu and Chilton, from Columbia’s Computer Science department, to help them design a set of scalable customizable open-source tools that can collect agricultural disaster risk data from millions of individual farmers living in some remote parts of the world. During the pandemic, Osgood, Wu and Chilton had already begun using their limited coding knowledge to cobble together small-scale web-based tools to collect data directly from thousands of farmers about the climate disaster risks they face. Until now, most index insurance products relied on informed guesswork and satellite data, but did not have the capacity to tap the wisdom of crowds of farmers themselves. The NSF’s financial support will allow them to respond to that demand with population-scale tools that are built to last.
State of the Planet spoke with Osgood about the NSF-funded project as well as his career path. The following interview had been edited for length and clarity.
How did you come to work at the intersection of financial instrument design, agricultural risk, and climate disaster?
It’s kind of a crazy journey in hindsight, how I gathered this odd mix of skills. As an undergraduate, I studied economics and engineering in a dual degree program and began working as a scientist on satellite telescope projects that look at the beginning of the universe. But it felt like I was just playing and having fun. I wanted to do something that was more connected to my roots.
I was born on a reservation in Arizona—I’m not Native American but my parents worked in healthcare on the reservation—and grew up in New Mexico, so I was always interested in things like climate and water and land. My professors at UC Berkeley said, “Try agricultural economics,” so I started my PhD in agricultural economics while I was still working in the labs building telescopes. Then as a PhD student, I supported the building of a lot of the early water markets in the American West, as well as climate and water market information systems for farmers that could help them plan water use.
You developed a talent for talking to farmers about what they need and how they make decisions, which has become a really critical part of your work. How did you pick up this skill?
So, I had a faculty position at the University of Arizona, where I did cooperative research. The research goal was not designed to support the research community, but to help on cooperative extension projects—to help the farmers. I worked in a NOAA-funded program called CLIMAS where my job was to talk with farmers about climate and science. Some of these farmers owned some of the biggest farms in the world, some of them were from Native American nations, and some of them were very low-income farm workers.
Early in your career, you played a big role in the creation of index insurance products for farmers. How did this come about?
In the early 2000s, the World Bank started supporting new index insurance projects. The staff thought they needed more data to design these products, but they discovered that what they really needed was someone who could talk with farmers and local decision-makers about science. At the end of the day, they needed to reconcile the experience of farmers with their remote-sensing and crop models and climate forecasts. That’s when the Bank approached Columbia’s International Research Institute for Climate and Society (IRI) for help, and as the climate economist at IRI, I was brought in to lead the work.

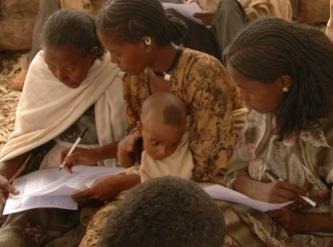
Farmers at a focus group meeting in Ethiopia. Credit: IRI
So, the index insurance models diverged pretty substantially from the farmers’ direct experience?
Yeah. I mean, it’s very easy to get it wrong. It’s very easy for farmers to be forced to buy something they don’t understand, or to have products not reflect the beneficiaries that they’re intended for.
Can you offer an example?
Well, for instance, in 2015 in Malawi there was this scandal. It was a very bad year for agriculture, so people in Malawi were expecting a major food security payout. The drought overwhelmed the government’s capacity to respond, because rather than set aside reserves, they had enrolled in an insurance plan, the Africa Risk Capacity project, to protect against large droughts and it failed to come through. The index model used by the Africa Risk Capacity project, run by the World Food Program (WFP), wasn’t registering enough hardship for a payout. We had a very small project with about five villages in Malawi and we did have a payout, so the WFP commissioned us to write a report to help unpack what went wrong.
What we found in Malawi was that the timing of the rainy season matters most, not total rainfall. So, we tried to match satellite data from the beginning and end of the rainy season with the recollections of the farmers to see if there was agreement. We also cross-checked different satellite data streams: one that looks at the cloud temperature to estimate the rainfall, for instance, and another that uses radar to look through the clouds and tell if the soil is wet. And we had different kinds of farmers in different situations cross-check with each other. What we found was that different years and parts of the season were important to different sets of farmers even within one village, because they were using different varieties of crop. The different losses from these different sets of farmers needed to be thought through for the insurance to work. The timing was off in the model they were using.
What are the consequences of getting the model wrong?
The consequences can be huge. If we get it wrong, the farmers don’t get payouts when they need them. If overall the country is having big droughts, these are going to overwhelm the national capacity for response. When you go from having a couple hundred farmers in an experiment to tens of thousands of farmers, the stakes go up, too. We’re trying to support these farmers to make smart and informed choices about their livelihoods, their ability to feed their kids and to plan their futures. The insurance products are intended for them, so we’re not comfortable unless they’re closely involved in the design process.
How do you ensure that you get good information from the farmers?
We have been using games. One way of gamifying a process is to use what’s called intrinsic motivation, where we’re not paying someone money, we’re giving them badges on their phone or some element of fun. But at the same time, we’re getting information, for example, about the satellites or historical climate or the forecasts; we’re getting information about what farmers’ needs are; and then we’re actually using this information to design something new together.
We used an application called IKON which turns a simple question into a game. So instead of just asking farmers directly how good or bad a particular season was, it asks them to try to guess better than their neighbors or the satellites how well their farms did in such and such a period. There is a series of these and farmers get badges based on how well they guess. It’s fun enough that people play it. So, the strategy now is to have researchers go to a few villages where things are most complicated or most representative of a region, and then use these games to go to a much broader place set of places.
We can also ask them to guess which past years the insurance product that they purchased would have given them payouts. In this way, we can find out if the farmers actually understand what’s been sold to them, which has been a problem with a lot of these projects.

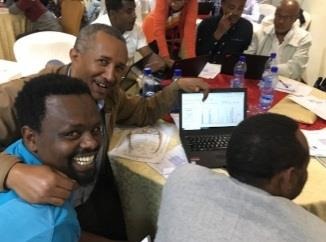
Experts working with the farmer data in Ethiopia to reconcile it with satellites in one of the IRI team’s prototype tools. Credit: IRI
Since you started this work, the popularity of index insurance for small farmers has grown quite substantially.
Yes, when I started working on index insurance, there were probably a couple thousand farmers covered by the instrument, and now there are many millions. It continues to grow. One project at Columbia under way now, called the ACToday Columbia World Project, is working to provide insurance to a million smallholder farmers. The benefits for farmers extend beyond just protection against climate risk—index insurance also gives them the financial security to take productive business risks.
So how did you build something that could collect information from these farmers at a large scale?
Right, so first we started prototyping tools to see if we could automate some of our surveys to work with larger numbers of farmers. During COVID, the number of these prototypes exploded because people couldn’t go into the field. So, there was this Wizard of Oz thing happening, where people collecting the data thought they were using software, but really, they were typing something into a web interface at the end of their work day, and thousands of miles away in New York, our team was programming it and analyzing it overnight so that it would appear in the interface a day or two later. So we were frantically hard coding this workflow.
The next step was to program web interfaces that would allow someone within Malawi or Ethiopia or Senegal to complete the analysis themselves through the web just as well as or better than we were able to do it in New York. And then the government of Zambia said, “Look, we have a national insurance product for millions of farmers across all of Zambia, but it was designed independently by a consultant and it isn’t tuned to the local reality. Could you set up design tools so we can create something that will work all across Zambia?” We realized we were in way over our heads with the technology, and that is where the NSF grant comes in.
How will the NSF grant help you move this work forward?
Basically, we were using tools that we had coded ourselves, but we’re not coders. These tools, designed for small-scale use, were already crashing often and we couldn’t fix them because our capacity was overwhelmed. And now, in the past year and a half, the projects have gone to a much bigger scale. They require a proper and adaptable software framework developed by computer scientists, not economists and climate scientists who dabble in coding. So it’s perfect timing with the NSF grant, because we have a much higher demand for our tools than we had expected.
What is especially novel about the technology that you’re building right now?
The exciting thing is that this kind of bottom-up approach has never worked before at a massive scale. There’s never been a framework that would allow millions of locals to drive decision-making on a project designed to benefit them, and it’s still completely based on science. It’s like artificial intelligence, but it’s actually human intelligence or community intelligence. In some ways, it’s a new kind of democracy. The local government can say yes and no, and make their decisions, but the citizens for whom the programs are designed are intimately involved in driving the process.
Is there a single core question that animates all your work?
I think the biggest question I have is how can the wisdom of each individual help solve a community-wide problem? I’m trying to coin this term “crowd core,” that refers to crowd-based cooperative research solutions to individual problems. I’m hoping crowd core is a door to a more cooperative future.
Source : columbia.edu