By Jason Franken
On Monday August 12, the National Agricultural Statistics Service (NASS) of the USDA released new planted acreage estimates for major crops in its monthly Crop Production report. For the first time, NASS used data on crop acreage enrolled in farm programs from the USDA Farm Service Agency (FSA) to update in August its planted acreage estimates for corn and soybeans. In previous years, NASS only updated acreage estimates for corn and soybeans using FSA data in September. This change reflects that, in recent years, nearly all planted acres are enrolled in FSA farm programs and those acres are nearly all enrolled by August. The Crop Production report lowered the corn planted area estimate from 91.5 to 90.7 million acres and increased the soybean estimate from 86.1 to 87.1 million acres.
Updated acreage estimates were a major reason soybean prices fell in the wake of the report release. USDA’s World Agricultural Outlook Board always uses the latest NASS acreage estimates in the commodity balance sheets released in its World Agricultural Supply and Demand Estimates (WASDE). Major acreage estimates for corn and soybeans typically include the Prospective Plantings report in March, the Acreage report in June, the Crop Production report in October, and the Annual Summary in January. However, the August acreage adjustment also had significant implications for the supply and demand balance with greater soybean supply and ending stocks for the upcoming 2024/25 marketing year.
In this article, we apply a procedure for using FSA acreage enrollment data to estimate final crop acreage. Prior articles (Irwin and Hubbs 2020, Franken 2023, and Janzen and Franken 2023) described a two-step process that, as early as August, offers a fairly accurate projection of the final acreage estimates reported in the NASS Annual Summary in January. Since NASS did not release its method for relating FSA data to its own acreage estimate, we compare results from our procedure to NASS’s recent August estimates. We then discuss the implications of these updated acreage projections for supply, ending stocks, and price. Our estimates suggest that 2024 corn and soybean acres are close to USDA’s long-run baseline projections for acreage and slightly higher than current NASS estimates. These production levels imply farm prices for corn and soybeans slightly below current USDA forecasts.
Estimating Final Acreage Using FSA Acreage Data
Mapping FSA acreage data to NASS estimates involves adjustments to reflect both additional acreage that will be FSA-enrolled between August and the end of the crop year and the expected difference in FSA acreage and NASS figures because not all farms and acres enroll in FSA programs. We estimate final acreage by making these adjustments based on average proportions from just the three most recent years. Given that recently released FSA numbers are reported as of August 9, and corresponding releases were as of August 2 in 2021, August 22 in 2022, and August 9 in 2023, these last three years should, on average, closely approximate relationships for the current year, as earlier years generally reflect acreage enrollments as of August 1, which tend to increase throughout the season.
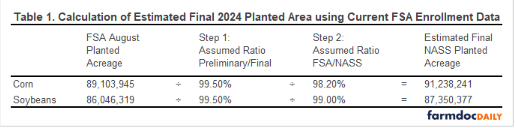
First, corn and soybean acreage enrolled in FSA farm programs by August each average 99.5% of that in January. Second, January FSA acreage numbers for corn and soybeans respectively average 98.2% and 99.0% of NASS estimates in the January Annual Summary. Table 1 presents the acreage estimates implied by these adjustments. Our planted acreage estimates are 91.2 million acres for corn and 87.4 million acres for soybeans; these are 0.6% higher for corn and 0.3% higher for soybeans than those given by NASS in the Crop Production report and included in the latest WASDE.
These higher acreage estimates for corn and soybeans are a return to early season acreage expectations like those released by USDA in its February Agricultural Outlook Forum grain and oilseeds outlook based on long-run USDA baseline acreage figures. Figure 1 shows the history of 2024 USDA corn and soybean planted area projections from the Agricultural Outlook Forum, March Prospective Plantings, June Acreage, and August Crop Production reports. Our estimates above are also shown for comparison. The initial February projections called for 91.0 million acres of corn and 87.5 million acres of soybeans. Our current forecast yields a combined corn and soybean acreage that is equal to the February forecast. If true, our estimates suggest 2024 acres ‘lost’ in earlier survey estimates have been found, contrary to historical experience with USDA acreage estimates (see Janzen 2024).
Ending Stocks and Price Estimates
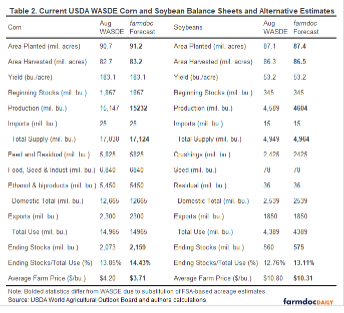
Replacing the current WASDE planted area estimates with those obtained above and keeping other assumptions from the WASDE supply and demand balance sheet facilitates an alternative supply and demand outlook with corresponding adjustments in anticipated prices. Table 2 presents this alternative balance sheet. Assuming the same percentage of planted acres harvested (91% for corn and 99% for soybeans), the larger FSA-based planted acreage estimates translate into more harvested acres. More acres along with the same yield, beginning stocks, and imports as in the current WASDE implies greater supply. Combining increased availability with identical assumptions about use leads to higher ending stocks-to-use ratios, which suggests lower prices.
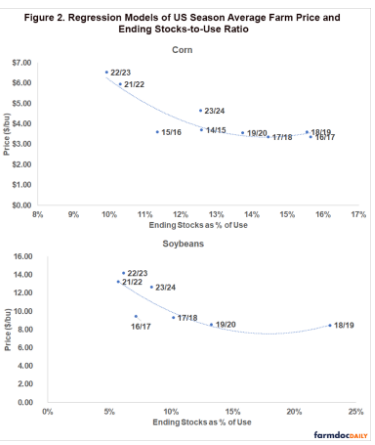
To generate the season average farm price forecasts in Table 2, we use a model similar to one derived by Irwin and Good 2016 to approximate the relationship between the stocks-to-use ratio and the USDA season average farm price. Given that supply and demand jointly determine price in economic theory, the ending-stocks-to-use ratio which reflects the supply carried over after meeting demand for that crop year, should be inversely related to price and is commonly considered in price forecasts for storable agricultural commodities. The relationship is depicted in Figure 2 below. It suggests a price of $3.71/bu for corn and $10.31/bu for soybeans. Last year, this same approach generated forecasts of $4.61/bu and $12.19/bu compared to WASDE estimates of $4.90/bu and $12.70/bu and realized prices of $4.65/bu and $12.65/bu, with both sets of estimates benefiting from the accuracy of yield forecasts (within 2 bu/acre for corn and 1 bu/acre for soybeans) and use.
As a caveat, in recent years used to model the FSA-NASS acreage relationships, FSA reported acreage enrollments have grown less from August to January than in the past, and January FSA and NASS data have been more similar, which may reflect greater enrollment of planted acres in farm programs. If those trends continue, then the approach used here could overestimate acreages and underestimate prices somewhat. However, if this year turns out to be more like earlier years, then even higher acreage and lower prices may be realized. These points coupled with the yield implications of more plentiful rains this summer than last, suggest it is prudent to think about downside price risk management.
Source : illinois.edu