By Vasudha Sharma
Determining crop water use, or evapotranspiration (ETc), is the most important component of irrigation scheduling. Weather data is key to calculating crop water use, but growers may not have a weather station nearby, and regardless, weather conditions can vary dramatically from field to field. Irrigators in Minnesota are looking at new tools, such as ETgage, that can provide the field-level data they need to calculate crop water use. This past year, we tested ETgage in Minnesota in order to see how accurate it is compared to a weather station.
Calculating crop water use
In general, a two-step approach is used to calculate crop-specific water use, as per the following equation:
ETc = ETref x Kc
In this equation, ETref is reference evapotranspiration, the evapotranspiration of the reference crop (usually grass or alfalfa), and Kc is the crop coefficient. ETref is usually estimated using an equation that uses weather variables as inputs. These variables include solar radiation, air temperature, wind speed, and relative humidity, which can vary over a short distance. Kc is an adjustment factor called crop coefficient, which integrates the effect of characteristics that distinguish a typical field crop from the reference crop.
In most cases, determining ETref could be a difficult task due to the complexity of the equation used to determine it, and in some cases, due to the unavailability of weather stations. In such cases, there are alternative methods, such as atmometers like ETgage (photo on right above), that can be used to determine ETref and do not require complex calculations or weather stations. ETgage is a device that simulates crop water use from a plant canopy. It has a canvas-covered ceramic evaporator plate at the top that allows water to evaporate the same way a crop does. Details about the ETgage and Kc tables for different crops can be found at z.umn.edu/ETgage.
Since there are not many weather stations available in Minnesota that provide ETc information for irrigation scheduling, ETgage could be used. However, it is critical to evaluate the accuracy of this tool under Minnesota’s climate by comparing the ETref measured by ETgage with ETref estimations from weather station data.
Evaluating ETgage
We evaluated the accuracy of ETgage to estimate ETref in St. Paul, Minn. during the 2019 season. We installed an ETgage right next to the University of Minnesota Research Weather Station on the St. Paul Campus (photo on right above). The ETgage was installed one meter above the grass surface and away from any obstruction, such as trees, buildings, etc. We then compared the readings from ETgage with the ET estimates from the research weather station.
Results
Daily estimates of ETref calculated using weather data and from ETgage are presented in figures 2 and 3 (below). Both methods produced similar ETref values. In general, when ETref increased, ETgage values tended to be higher than the weather station values and when ETref decreased, ETgage values were lower than or equal to the weather station value. From August 1, 2019 to October 28, 2019, total ETref measured by ETgage and weather station was 9.4 inches and 8.4 inches, respectively. We observed a very strong relationship (R2 = 0.95) between the two methods. Overall, our results indicate that ETgage can provide reasonable estimates of ETref and can be used for irrigation management when adjusted with crop coefficients (Kc) to estimate ETc. For example: On August 11, ETref measured by ETgage was 0.16 inches. From Kc tables, on August 11, corn Kc was 0.99. Therefore ETc = ETref x Kc = 0.16*0.99 = 0.158 inches.
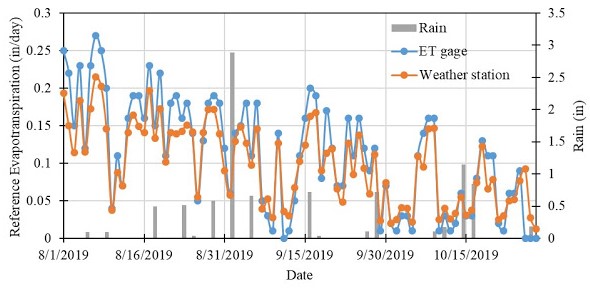
Figure 2. Daily Reference ET (ETref) values for UMN Saint Paul Campus Research Weather station and an ETgage during August-October 2019
Figure 3. Comparison of daily reference ET (ETref) values for UMN Saint Paul Campus Research Weather station and an ETgage during August-October 2019
Things to remember
- ETgage can be read manually or interfaced with a data logger so that daily ETref values can be recorded.
- For manual reading, ETgage should be read once or twice a week.
- Once you have the ETref from ETgage, the next step is to take into consideration the crop being grown and the growth stage of the crop to determine the crop coefficient. Kc tables for commonly grown crops in MN can be found at z.umn.edu/ETgage.
- ETgage should not be installed near a building, tree, or in a parking lot, as these obstructions can affect the readings.
- ETgage should be installed at least 1 meter above the ground surface and preferably near well-watered grass or pasture.
- ETgage should be removed from the field before frost.
Source : umn.edu