By Amy Cooper and Mitchell Baum et.al
Optimum nitrogen fertilizer rates for corn can vary by more than 100% from field-to-field and year-to-year. This variability is a product of near limitless interactions among crop genetics, management, and environment factors (weather & soil type). Among them, the amount of soil inorganic nitrogen in the soil is one of the most important (Baum et al., 2024).
Through the Iowa Nitrogen Initiative (INI), which is a partnership between Iowa State University and farmers, we sampled 30 farmers’ fields (N-trials) spread across Iowa in 2024 to quantify soil inorganic N levels (Fig 1). In each field, we measured soil inorganic N from 0-12” and 12-24’’ at the lowest (zero), middle, and highest nitrogen fertilizer rates.
We found that in 96% of the fields, soil inorganic nitrogen levels in the top 12” of soil were less than 20 lbs N/acre (Fig. 2). For reference, this is the lowest level of residual soil nitrogen in the N-FACT decision support system. In conventional outputs of soil tests such as the LSNT, 20 lbs of nitrate-nitrogen in the top 12” is about 6 ppm.
The 2024 post-harvest N levels (range 1.5 to 15.5 lbs/acre) were lower than that observed in 2023 (range 2.5 to 43.6 lbs/acre; Fig. 2). Lower levels in 2024 are likely due to a wetter growing season that led to higher corn yields (higher nitrogen uptake) and higher environmental losses. Soil nitrogen at 0-12” also positively correlates with soil nitrogen at 12-24,” so low soil N at 0-12” can be indicative of low soil N at greater depths. Furthermore, the majority of total inorganic nitrogen was NO3-N rather than NH4-N.
Going into crop year 2025, farmers can use the information that in 96% of the fields the soil nitrogen was less than 20 lbs N/ac, along with the N-FACT decision support system and knowledge about nitrogen cycling to adjust nitrogen rates accordingly. While our soil sampling is indicative statewide patterns, every field is different. We encourage farmers and agronomists to soil sample, consider the details of your operations, and use N-FACT when deciding on nitrogen rates for 2025.
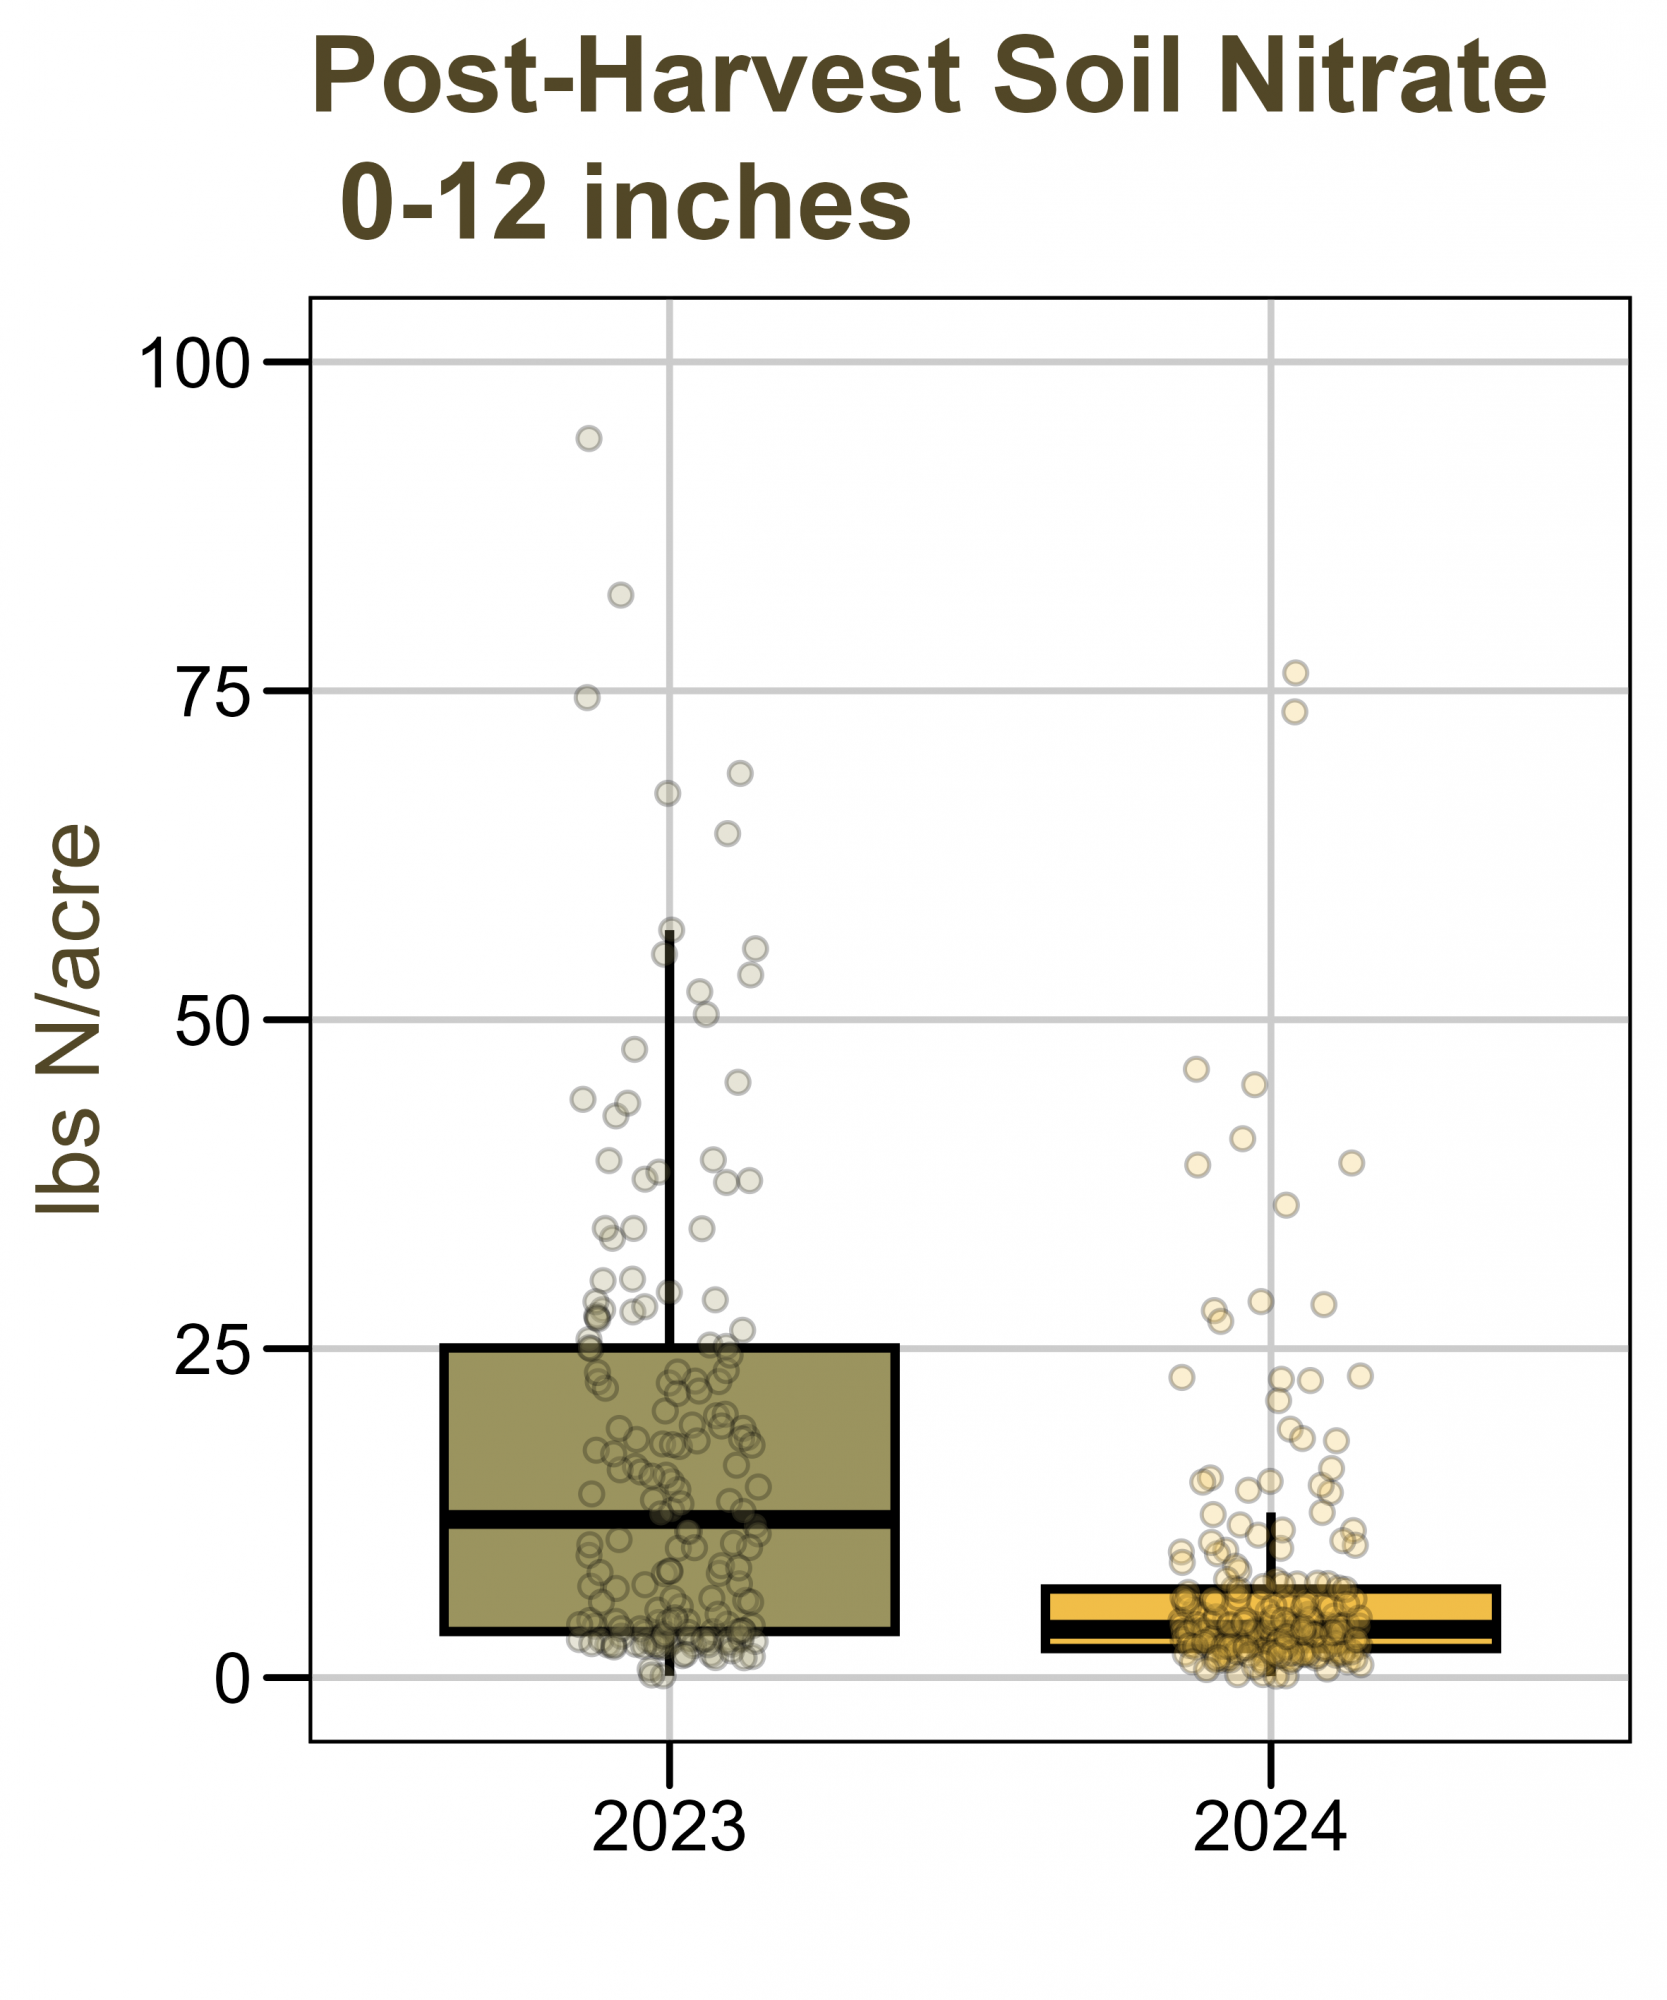
Fig. Pounds of soil nitrate sampled post-harvest in the 0 to 12” of soil from trials in 2023 and 2024. The points represent actual measurements, the box plots show the median and the 25th-75th percentiles.
Source : iastate.edu