By Gary Schnitkey, Krista Swanson, Jonathan Coppess, Nick Paulson
Department of Agricultural and Consumer Economics
University of Illinois
Ben Brown and Carl Zulauf
Department of Agricultural, Environmental and Development Economics
Ohio State University
Agricultural Risk Coverage at the Individual Level (ARC-IC) will make payments in 2019 for farms that are entirely prevented plant or farms with low yields (see farmdoc daily, October 29, 2019, January 7, 2020, February 4, 2020, and February 11, 2020). ARC-IC combines all Farm Service Agency (FSA) farms within a state for one individual payment entity consisting of all FSA farms enrolled in a state. The payment by this aggregate ARC-IC farm does not equal the average of the ARC-IC payments or a weighted distribution of entire FSA farm payment for each of the individual FSA farms. A multiple FSA farm ARC-IC payment calculator spreadsheet has been developed and is available in the 2018 Farm Bill What If Tool. This tool is described in this article. Other information about ARC-IC also is provided.
Information about ARC-IC
Besides the 2018 Farm Bill What If Tool, more detail on ARC-IC is available in farmdoc‘s Farm Bill Tool Box. This information includes several articles on ARC-IC that appeared on farmdoc daily (October 29, 2019, January 7, 2020, February 4, 2020, and February 11, 2020). Also, YouTube videos that are part of the 5 minutes farmdoc daily series further explain ARC-IC. These YouTube videos are available in a playlist at https://go.illinois.edu/ARC-IC, which includes the following titles:
- What is ARC-IC?
- Who Should Use ARC-IC?
- What Yields Should I Enter for 2019 in ARC-IC?
- ARC-IC Benchmark Revenue Calculations.
- Selecting Farms to Enroll in ARC-IC.
- ARC-IC Multi FSA Farm Tool.
Multi-Farm ARC-IC Spreadsheet
The Multi-Farm ARC-IC spreadsheet is part of the 2018 Farm Bill What If Tool, a Microsoft Excel spreadsheet that is available for download at the 2018 Farm Bill Tool Box. The 2018 Farm Bill What IF Tool includes the following four spreadsheets:
- ARC-CO PLC Comparison — Compares county-level ARC-CO and PLC payments for user-specified entries for county yields and prices in 2019 and 2020. This scenario-analysis tool allows comparison of payments for specific yields and prices.
- PLC Updating Tool — Computes the PLC yield that will result under updating for user-entered yields from 2013 to 2017.
- 2019 ARC-IC Payment Calculator (for one Farm) — Calculates 2019 payments from ARC-IC for one Farm Service Agency (FSA) farm.
- 2019 ARC-IC Payment Calculator (for multiple farms) — Calculates 2019 payments from ARC-IC when a payment entity enrolls more than one FSA farm into ARC-IC.
Last week, the fourth tool that computes ARC-IC payments for multiple FSA farms enrolled in ARC-IC was added to the Tool.
Using the 2010 ARC-IC Payment Calculator for Multiple Farms
If more than one FSA farm is enrolled in ARC-IC, benchmark revenue and 2019 revenue will be combined across all farms enrolled in ARC-IC based on acres planted to each crop on each farm (see farmdoc daily, February 11, 2020, for more information). FSA calls the FSA farms aggregated together an ARC-IC farm, with all farms enrolled in a state being combined.
The ARC-IC payment of the combined farms is not necessarily the same average payment that would be calculated by averaging the base acre payments from farms enrolled individually in ARC-IC. Take, for example, two FSA farms with 100 base acres. Suppose Farm 1 has a $20 per base acre payment, and Farm 2 has a $0 per base acre payment if the farms are enrolled individually in ARC-IC. Furthermore, assume the $20 per base acre payment is not capped at 10% of benchmark revenue. In this case, combining farm 1 and 2 into one ARC-IC payment entity will result in a combined ARC-IC payment that is less than or equal to $10 per acre, the average of the $20 and $10 per acre for farms 1 and 2 respectively. On the other hand, if the $20 payment on farm 1 is at the 10% revenue cap, combining the two farms could result in a payment greater than $10 per acre.
The Multi-Farm ARC-IC Tool will evaluate payments from enrolling different combinations of FSA farms in ARC-IC. Users will indicate the state that the farms are located in, along with the number of FSA farms in the state. The tool allows up to ten FSA farm numbers.
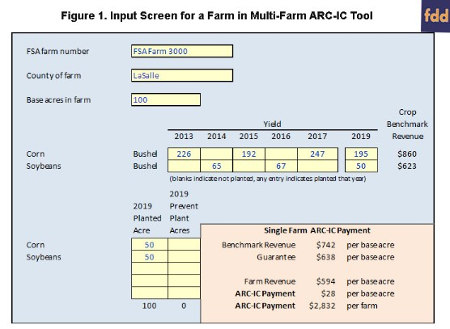
Then, users will enter four types of information for each farm (see Figure 1).
- County of the farm. ARC-IC uses substitute yields in cases where planted acre yields are below 80% of a t-yield or no verifiable records are available for the relevant crop. In years where the relevant crop is not planted in an individual year county-specific trend adjusted average yields are used.
- Base acres on the farm. Payments will be made on all base acres on a farm. The division of base acres between crops does not matter for ARC-IC payments unlike ARC-CO or PLC.
- Yields in each year the crop was planted from 2013 to 2017, as well as yields in 2019. The yields for 2013 to 2017 are used to determine benchmark revenue. The 2019 yields determine revenue in 2019 (see farmdoc daily, February 4, 2020, for more information).
- Planted and prevented plant acres in 2019. These acres determine the weights of benchmark revenue and 2019 revenue (see farmdoc daily, February 4, 2020, for more information). In the tool, prevent plant acres are those as defined by FSA, which could differ from those for crop insurance purposes.

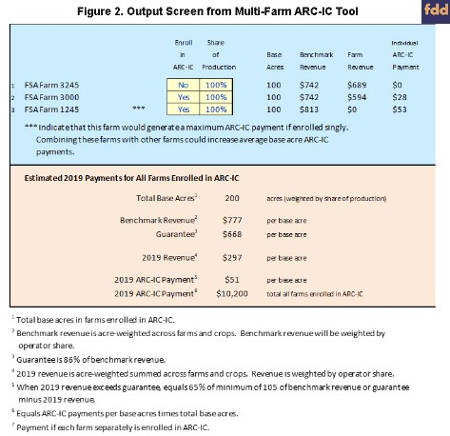
An output page in the ARC-IC spreadsheet will then list each FSA farm. The example in Figure 2 shows three FSA farms. For each farm, the spreadsheet list base acres, benchmark revenue, farm revenue, and individual ARC-IC payment. In Figure 2, ARC-IC will make a $0 per base acre payment on FSA farm 3245, $28 per base acre on FSA Farm 3000, and $0 per base acre on FSA farm 1245. Users can then indicate which of the farms are to be enrolled in ARC-IC, and the tool will calculate a payment across the combined farm. In the example, FSA Farms 300 and 1245 are enrolled in ARC-IC with a $51 per base acre payment across the combined farms. Total ARC-IC payments would be $10,200 over 200 total base acres in the two FSA farms.

Strategies for Enrolling Farms in ARC-IC
A suggested strategy for determining whether to enroll FSA farms in ARC-IC, is to begin with the FSA farm that has the highest per acre ARC-IC payment on an individual basis and work the way down the list, deciding when to stop adding farms. The remaining farms would be enrolled in Price Loss Coverage (PLC) or ARC at the county level (ARC-CO).
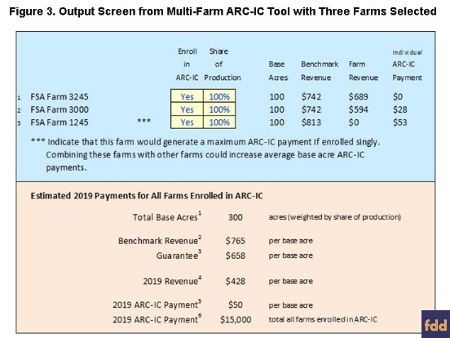
In the example farm, the first selection would be FSA farm 1245, with a per base acre payment of $53 per acre. Then, FSA farm 3000 with a $28 per base acre payment will be added, followed by FSA farm 3245 with a $0 per acre payment. Combining this farm with FSA farm 3000, which has $28 per base acre, will result in the combined farm having a 2019 ARC-IC payment of $51 per base acre (see Figure 2). Note that the payment dropped very little from the $53 per base acre payment for FSA Farm 1245 alone. This occurs because FSA Farm 1245 reached the maximum payment equal to 10% of benchmark revenue, as indicated by the series of asterisks (“***”) next to the farm in the tool (see Figure 3). The potential ARC-IC payment to FSA farm 1245 that is not permitted by the 10% cap can be captured by spreading it over the additional base acres of FSA farm 3000. Thus, payment per base acre for the combined FSA farms is only slightly lower than for the higher per acre payment and much above the lower per acre payment. This spreading of capped payments over more base acres continues if FSA farm 3245 is also enrolled in ARC-IC. Enrolling all three FSA farms in ARC-IC results in an ARC-IC payment of $50 per base acre over 300 acres, or $15,000 total.

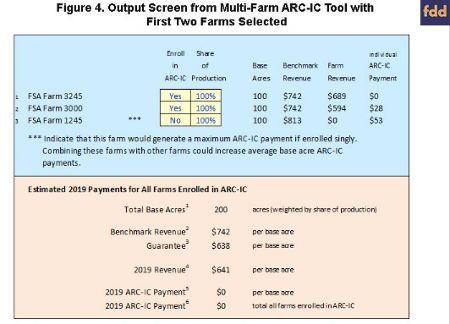
Combining farms will not necessarily result in higher payments in all situations. To illustrate, assume there are only two FSA farms: FSA Farm 3245 ($0 per base acre payment if enrolled individually in ARC-IC) and FSA farm 3000 ($28 per base acre payment if enrolled individually in ARC-IC). Combining these two FSA farms results in $0 per base acre payment (See Figure 4). The payment maximizing choice in this situation is to enroll only FSA farm 3245 in ARC-IC.

The strategy of starting with the farm with the highest ARC-IC payment and working down is fairly robust. Farm sizes and shares of production could also enter into the decision process. Other factors, such as productivity of farmland may enter as well. How those factors enter the decision process will be specific to each farm situation.
How many farms to enroll in ARC-IC likely will be influenced by potential 2019 payments from the alternatives: PLC and ARC-CO. Currently, we are not expecting large payments PLC payments for corn and soybeans. PLC will make large payments for wheat. ARC-CO will make payments in some counties, but likely will not make payments in most counties. On February 20th, National Agricultural Statistical Service (NASS) will release county yields for corn and soybeans. These yields will be used to update estimates in the Gardner ARC/PLC Payment Calculator (https://fd-tools.ncsa.illinois.edu/).
Summary
ARC-IC will make payments on some Midwest farms in 2019. The above strategy attempts to maximize payments in ARC-IC in 2019. Aside from unique circumstances, it is not likely that ARC-IC will make payments in 2020. High ARC-IC payments in 2019 need to be weighed against the potential for 2020 payments in other programs. Of course, ARC-CO and PLC may not make payments in 2020.
At this point, our advice remains the same as before (see farmdoc daily, January 22, 2020). We suggest that farmers evaluate ARC-IC for their individual Farm Service Agency (FSA) farms, especially when there are prevent plant acres or when yields are below average. This evaluation can be done using the 2018 Farm Bill What If Tool. If ARC-IC is not expected to make payments, the following will likely hold:
- Corn: We expect that neither PLC nor ARC-CO will make payment on most farms in 2019 (see farmdoc daily, January 22, 2020). ARC-CO could make payments in a limited number of counties in 2019, with those counties in areas of very late planting. For 2020, PLC likely has a higher chance of payment and higher expected payments than ARC-CO, given current price levels. We suggest farmers enroll in PLC.
- Soybeans: PLC is not expected to make payments in 2019. There is a reasonable chance that ARC-CO will make payments in some counties in 2019. For 2020, the likelihood and expected level of payments are about the same between ARC-CO and PLC. We suggest that the farmer consider enrolling in ARC-CO.
- Wheat: There is a near certainty of PLC payments in 2019 and a very high chance of PLC payments in 2020. ARC-CO will make payments in many counties in 2019, but those payments likely will be lower than PLC payments. The level of a PLC yield on a farm will matter in this determination, so evaluating your own FSA farms in the Farm Bill What If Tool is recommended. Most farmers will find PLC to be the alternative with the highest payments.
On February 20th, National Agricultural Statistical Service (NASS) will release their estimates of county yields. While FSA will not use these in determining ARC-CO payments, the yields will provide reasonable estimates of ARC-CO payments for 2019. We will make this information available on farmdoc daily, and a webinar on February 24th will cover this material: https://farmdoc.illinois.edu/events/category/farmdoc-webinar
March 15th is the deadline to complete ARC and PLC choices.
Source : farmdocdaily