By Carl Zulauf and Gary Schnitkey
Most crop insurance is bought for a single crop. Since prices, yields, and revenues are not perfectly correlated across crops, multicrop insurance has the potential to reduce premiums, an important factor in farmers’ crop insurance decisions (see, for example, Knight and Coble (1997) and Woodward (2016)). Insuring corn and soybeans jointly as opposed to individually is found to reduce indemnities / premiums by 19% on average for the states in this study. Adding wheat to corn-soybean multicrop insurance reduces indemnities / premiums by 37%. A strong interaction is found between multicrop insurance and irrigation, resulting in further reductions.
Corn-Soybean MutiCrop (MCI) Insurance
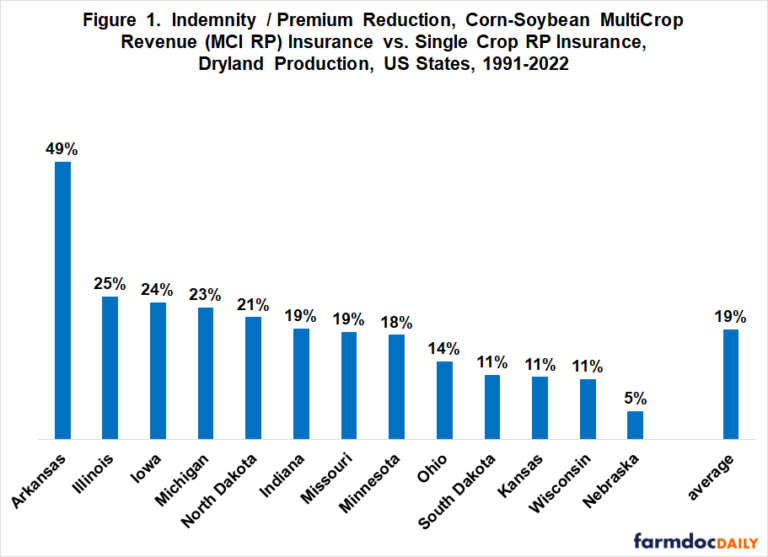
Compared with insuring corn and soybeans individually during the 1991-2022 crop years, jointly insuring the two crops would have reduced indemnities by 19% on average for the 13 large corn or soybean producing states in Figure 1. Assuming crop insurance is actuarially fair, a reduction in indemnities translates into an equivalent reduction in premiums. The indemnity / premium reduction ranged from 5% (Nebraska) to 49% (Arkansas). Excluding Arkansas, the largest reduction was 25% (Illinois) and the average reduction was 17%. These findings are for dryland production of corn and soybeans and for Revenue Protection (RP), the insurance product most often purchased for corn and soybeans. See Data Note 1 for further discussion of the procedures used to generate the findings.

Insurance Coverage and MCI
Arkansas’ relatively large indemnity / premium reduction reflects in part the lower coverage elected by Arkansas farmers. Over the 2011-2023 crop years that RP has been offered, Arkansas corn and soybean coverage averaged 68% and 66%, respectively. Excluding Arkansas, the lowest coverage was 73% for both Kansas corn and soybeans.
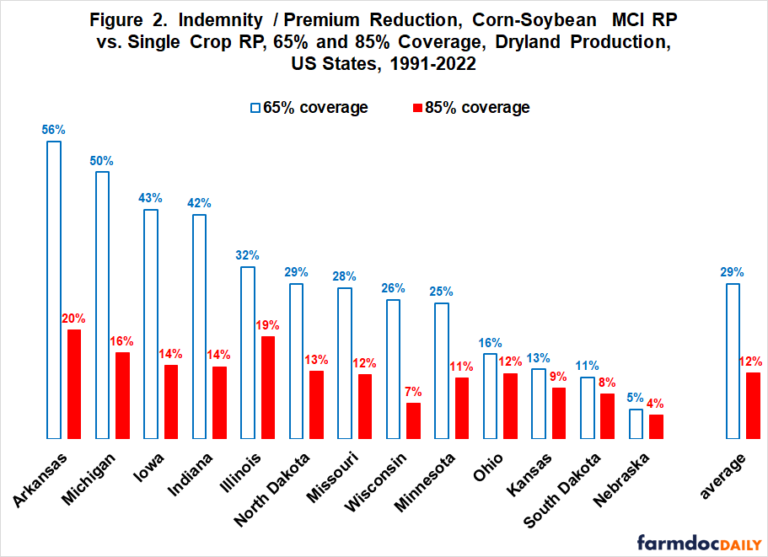
Figure 2 illustrates the larger reduction in indemnities / premiums at lower coverage levels using 65% and 85% coverage. For all 13 states, the reduction is larger at 65%. The average reduction is 17 percentage points larger at 65% than at 85% coverage (29% -12%). Arkansas has the largest difference for an individual state: 36 percentage points (56% – 20%).

Irrigation and MCI
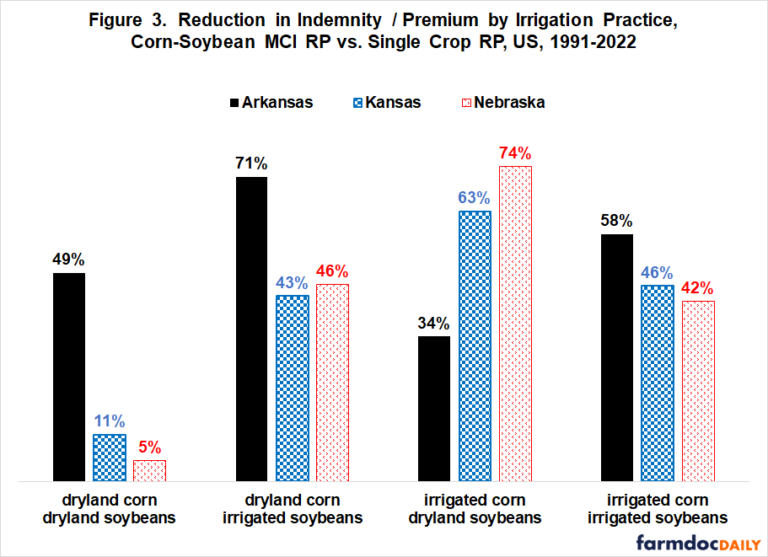
According to the 2022 Census of Agriculture, three quarter of corn and soybean acres were irrigated in Arkansas. For Nebraska, 53% of corn and 44% of soybean acres were irrigated. For Kansas, one quarter of corn and 8% of soybean acres were irrigated. Irrigation has a notable impact on indemnity / premium reductions from corn-soybean MCI insurance, especially for Kansas and Nebraska (see Figure 3). In Arkansas, the reduction largest was for dryland corn and irrigated soybeans while, in Kansas and Nebraska, the reduction was largest for irrigated corn and dryland soybeans. The only combination involving irrigation that had a smaller reduction than dryland production of both crops was irrigated corn and dryland soybeans in Arkansas (34% vs. 49%).

Corn-Soybean-Wheat MCI
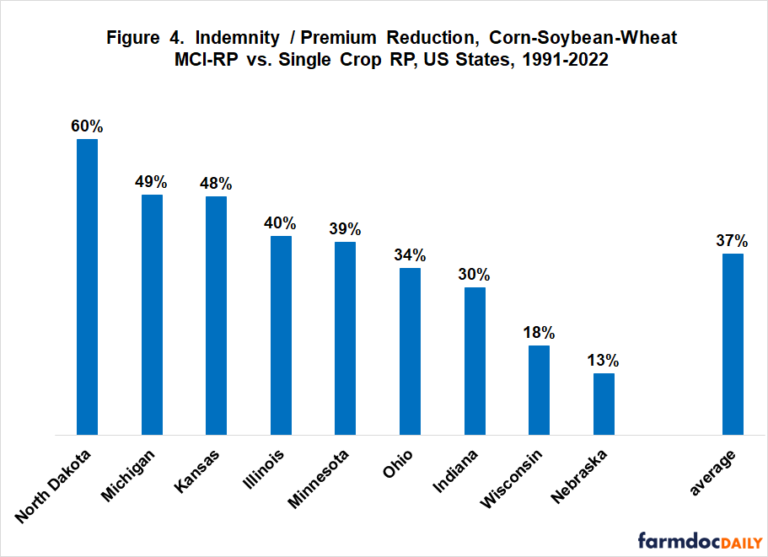
Adding wheat to corn and soybeans in MCI resulted in a larger indemnity / premium reduction for all states in Figure 4 (see Data Note 2). Average reduction with corn-soybean-wheat MCI was 37% vs. 16% for the same states with corn-soybean MCI. The added reductions when wheat is added to corn-soybean MCI did not require a large share of wheat. Over the 2011-2023 crop years, wheat’s share of corn-soybean-wheat insured acres was 0.8% (Nebraska), 2.0% (Indiana), 2.4% (Illinois), 3.8% (Wisconsin), 4.2% (Ohio), 6.6% (Minnesota), 9.7% (Michigan), 19.2% (North Dakota), and 27.9% (Kansas). However, the higher was wheat’s share of MCI insured acres, the larger was the indemnity / premium reduction from adding wheat to MCI. Correlation between these two variables is +0.91 for the states in Figure 4. The additional reduction due to wheat ranged from eight percentage points for Nebraska and Wisconsin to 37 and 38 percentage points for Kansas and North Dakota, respectively.

Discussion
Corn-soybean and corn-soybean-wheat multicrop insurance (MCI) is found to reduce indemnities and, assuming actuarial fairness, premiums by 19% and 37%, respectively, for the states in this study.
At a time when cost of production is a key farm management issue, MCI would provide farmers a lower premium individual farm insurance product, by far the crop insurance product most commonly bought.
Offering MCI would also be consistent with encouraging both a mix and rotation of crops, both of which have environmental and risk management benefits.
Since county yields are used in this study, the estimated indemnity / premium reductions are in addition to reductions from the geographical diversification of producing a single crop imbedded in the widely-purchased enterprise insurance. An implication is that premium subsidies should be higher, probably notably higher, for MCI than for enterprise insurance.
The current Whole Farm insurance unit (WU) is similar but different from MCI. WU must contain all insurable acres of all insurable crops. MCI could be any combination of insurable crops. They would not have to be all insurable crops in a county. MCI could involve multiple counties, just as multicounty enterprise insurance. Premium subsidy rates for WU are the same as enterprise insurance at coverage levels less than 75% and only three percentage point higher for 75% and higher coverage levels (farmdoc daily, May 15, 2024). WU’s current design likely explains why less than 50,000 combined acres of corn, soybeans, and wheat have been in WU in each year since 2010 (farmdoc daily, May 15, 2024).
Policy options are to alter WU’s current design to make it more flexible and financially attractive or to create a new insurance product.
A redesigned WU or new MCI insurance contract would be an addition to current insurance options. Farmers may or may not purchase it depending on their evaluation of its reduction in premiums vs. its reduction in indemnities vs. its impact on their management of risk. However, assuming the insurance loss ratios for the individual crops are less than 1.0 and assuming the premium subsidy savings from MCI would be used to increase the premium subsidies for MCI (i.e. assuming Federal budget neutrality), then on average farmers should save more from the lower premiums for MCI vs. individual crop insurance than they would give up in foregone insurance indemnities.
Acknowledgement
The authors gratefully acknowledge the financial support of the Midwest Soybean Collaborative and the Ohio Corn and Wheat Growers Association for this analysis.
Data Note 1: Analytical Procedures
The multicrop insurance (MCI) examined in this study starts with the current RMA single crop RP contract. One step is added — individual crop insured liability and harvest revenue are weighted by the crop’s share of total insured acres to calculate MCI’s insured liability and harvest revenue. This step captures the impact of crop diversification upon insurance losses. Diversification occurs because prices, yields, and revenues of individual crops are not perfectly correlated. Since revenue from one crop can offset declines in another crop, MCI may not pay when single crop insurance pays.
The MCI calculations discussed below are for corn-soybean MCI. Corn-soybean-wheat MCI has the same design except wheat is included in the calculations.
.png)
Insured corn and soybean acres are the same for MCI and single crop insurance. An insurance indemnity is paid when harvest revenue is less than (insured liability • insured coverage level).
The reduction in indemnities and premiums (assuming actuarial fairness) is estimated using US Department of Agriculture, Risk Management Agency (RMA) county yield data for the 1991-2022 crop years. These yields are used to rate SCO (Supplemental Coverage Option) insurance. This data set includes both RMA’s calculation of actual yield per planted acre and its estimate of expected yield for the year. Yields are available for dryland production and irrigated production. Insurance prices for corn, soybeans, and wheat grown in a state are from RMA starting with the 2011 crop year. Prices for years before 2011 came from a data set created by Art Barnaby.
Coverage level is calculated by state and crop using RMA data on RP insurance purchased by farmers over the 2011-2023 crop years. Average coverage is calculated using coverage levels weighted by the share of state RP acres insured at a given coverage level. The coverage level for corn-soybean MCI is the average of the state average coverage levels for corn and soybeans. The coverage level for corn-soybean-wheat MCI is the average of the state average coverage levels for corn, soybeans, and wheat. Share of total insured corn, soybean, and wheat RP acres in each individual crop is the average for a state over the 2011-2023 crop years.
Data Note 2: Wheat Variety
The insurance prices used for wheat were for the wheat variety most commonly planted in the state. Insurance prices for soft red winter wheat were used for Illinois, Indiana, Michigan, Ohio, and Wisconsin. Insurance prices for hard red winter wheat were used for Kansas and Nebraska. Insurance prices for hard red spring wheat were used for Minnesota and North Dakota. South Dakota averaged 2.6 million acres of insured wheat over the 2011-2023 crop years, but wheat acres in South Dakota are almost evenly divided between hard red winter and hard red spring. These wheat varieties use different futures contracts for prices and have different price discovery periods. It was therefore decided not to include South Dakota in the analysis.
Source : illinois.edu