By Elliott Dennis
The changes to the U.S. Department of Agriculture’s (USDA) Risk Management Agency (RMA) Livestock Risk Protection (LRP) insurance plan took effect on January 20, 2021, for the crop year 2021 and succeeding crop years. These changes included: (a) increasing livestock head limits for feeder and fed cattle to 6,000 head per endorsement/12,000 head annually and swine to 40,000 head per endorsement/150,000 head annually; (b) modifying the requirement to own insured livestock until the last 60 days of the endorsement; (c) increasing the endorsement lengths for swine up to 52 weeks; and, (d) creating new feeder cattle and swine types to allow for unborn livestock to be insured. These changes, in addition to the dramatic changes in subsidy levels and allowing premiums to be paid at the end of the coverage endorsement period, should significantly improve the use of LRP. How much so likely depends on several factors including an understanding of risk protection, personal attitudes towards risk, previous experience with risk management tools, and competing risk management options, among others.
How frequently is LRP used compared to other USDA-RMA offered insurance products?
Cattle can be insured through various existing USDA-RMA products. Options include Livestock Gross Margin (only fed cattle), Livestock Risk Protection (fed and feeder cattle), and Whole Farm insurance (fed and feeder cattle). Federally subsidized insurance was first offered in 2003. Between 2003-2010, the total liability of LRP fed and feeder cattle represented $722 million dollars, and 25,000 policies covering 0.94 million head. Between 2011-2019, the total liability of fed and feeder cattle under LRP represented $1,950 million dollars, and 51,000 policies sold covering 1.65 million head. LGM is used much less frequently compared to LRP. Between 2003-2010, the total liability of LGM fed cattle represented $32 million dollars, and 616 policies covering 50,000 head. Between 2011-2019, the total liability of fed and feeder cattle under LRP represented $27 million dollars, and 301 policies sold covering 20,000 head.
While there was a large increase in LRP use over the last decade, LGM cattle products have decreased. Further, the levels of liability, policies sold, and head covered are small compared to other programs and commodities such as the Dairy Margin Coverage for milk, LRP Lamb, and LGM for swine. Comparing the total number of fed and feeder cattle insured using USDA-RMA products to the total number of cattle in the United States show that coverage still represents a small fraction of total production. Approximately 0.50% of fed and feeder cattle are insured using either LRP or LGM. These shares are comparable to swine and dairy. Lamb producers have historically been heavy significant users of USDA-RMA products. In some years, upwards of 60% of total lamb production was insured using LRP. The high use is likely because lamb producers have very few other available market options to manage output price or feeding margin risk.
LRP and LGM Use and Performance Varies Geographically and Through Time
A small number of states make up the majority of LRP fed and feeder cattle sales. Since 2003, Nebraska, South Dakota, Kansas, North Dakota, and Missouri have made up 80-85% of all policies sold and the total number of head insured. The relative share of use by these states have remained constant over time (panel (a) in Figure 2). LRP fed cattle sales show similar patterns (panel (b) in Figure 2). The geographic distribution of policies sold is even more pronounced for LGM fed cattle. Iowa, Nebraska, and Wisconsin account for nearly 95% of all policies sold and the total number of head insured. This is slightly misleading given that only 16 policies were sold in 2019 and 155 at its peak in 2007.
Possible Explanations for LRP and LGM Use (or lack thereof)
Policy premiums and performance are two reasons explaining the use of LRP and LGM, or lack thereof. For LRP, premiums are comparable to an “at-the-money” or “out-of-the-money” put. As such, all premiums costs are entirely attributed to the “time value” of the option (i.e. the farther we are away from contract expiration = the higher the premium). Figure 1 shows how these premiums curves look at different coverage rates and endorsement lengths for a representative day. It shows that the longer the endorsement length, the more expensive the premium ($/cwt.). In other words, the curves shift vertically up the farther one is away from contract expiration. Producers choosing to manage price risk using options must choose between using USDA-RMA’s LRP or CME put options. How similar these premiums are, both with and without subsidies, is currently being studied.

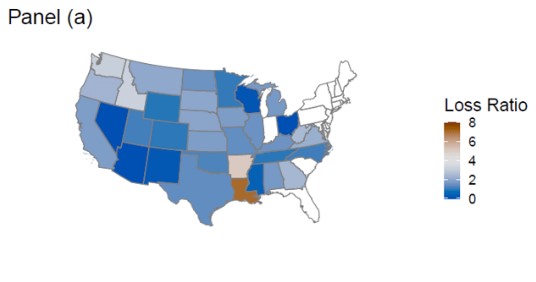
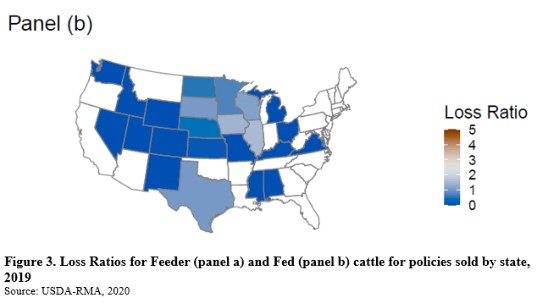
How reliable a market instrument is as managing price risk is another important consideration. If LRP is unreliable as a market instrument over time, then this may reduce the trust and ultimately use of the product. Loss ratios are one method used to determine how well an insurance product is functioning. One way to interpret loss ratios are for every dollar paid into the product, how much is paid out. Loss ratios below one “hurt” producers since they are paying more than what they get back in coverage while loss ratios > 1 “hurt” the insurer since the product is paying too much out compared to premiums received. Ideally, long-term loss ratios should be equal to one. The loss ratio for feeder and fed cattle under LRP does vary considerably across locations and through time. Some states have either historically high or low loss ratios. For LRP feeder cattle, 4 out of the 37 states have long-term loss ratios between 0.90-1.10, 28 states have loss ratios < 0.90, and 5 states have loss ratios > 1.10. LRP and LGM fed cattle are less promising. All states that have used LGM or LRP fed cattle have loss ratios below 0.80. Few states having long-term loss ratios at or near 1.0 is one reason why the use of LRP or LGM has been low. Three animations are available from LMIC or available upon request from me that showing loss ratios by state between 2003-2019. These animations show that LGM and LRP (fed and feeder cattle) have both expanded in use but loss ratios have tended to vary significantly over time. Figure 3 shows 2019 LRP fed and feeder cattle loss ratios by state.


Industry Implications
The industry has lobbied the USDA-RMA to increase the subsidy levels of LRP as a solution to market volatility experienced during COVID-19. Industry representatives have cited the subsidy differential between crop insurance and livestock insurance as the primary justification for increasing subsidy levels and suggesting that subsidy levels were the primary barrier to risk management adoption for smaller producers. Newly established subsidy levels should increase the use of LRP fed and feeder cattle. Whether the future use of LRP is by large operations switching from CME options to LRP or if small producers using LRP for the first time remains to be seen. The ability to insure unborn cattle and having premiums due at the end of the endorsement period are likely to be larger contributors to increasing the use of LRP than changes in the subsidy levels since they significantly reduce logistical barriers for producers. As with all risk instruments, LRP is still meant to be used to minimize downside price due to market shocks and not as a tool to improve market prices after market shocks have occurred. Thus, LRP, either fed or feeder cattle, will only work to mitigate future market shocks similar to COVID-19 if producers have risk management in place prior to the market shock.
Source : osu.edu