By Javed Iqbal and Aaron Nygren
With the recent increase in fertilizer prices, it is more important than ever to use the right amount of fertilizer to maximize the economic returns. Applying too little or too much fertilizer can result in substantial economic loss.
Nutrients Carry Over
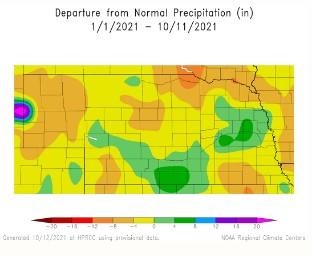
Unused fertilizer typically carries over from the previous year, depending upon the previous year’s weather patterns, soil texture, rate of organic matter mineralization, crop nitrogen uptake and crop yield. Most of Nebraska was drier than normal during the 2021 growing season (Figure 1). This may have limited downward movement of nitrate nitrogen (nitrate-N) in the soil profile, resulting in less nitrate leaching loss while also potentially reducing crop nitrogen uptake and crop yield, particularly for rainfed crops.
If you were in an area of the state with drier conditions, the residual soil N may be higher than normal for rainfed crops. Therefore, it is a profitable and environmentally sound practice to credit this residual soil nitrate-N in determining fertilizer-N rates for 2022. To credit residual nitrate-N, soil sampling to a two- or three-foot depth during fall or spring will help determine the amount of residual nitrate-N.

The timing of soil sampling for making N recommendations could be important as snowmelt and precipitation during early spring may affect N losses (especially for coarse-textured soils), resulting in under application of pre-plant or in-season N. Collecting pre-plant soil nitrate-N soil samples is a good practice for determining residual soil nitrate-N to be credited in N rate decisions. For more information on soil sampling, see Guidelines for Soil Sampling, NebGuide 1740.
High Fertilizer Cost and Potential Cost Reductions
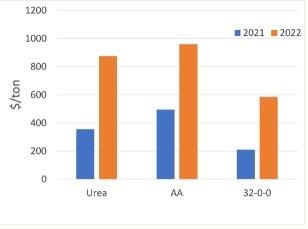
Recently, due to various global factors, fertilizer prices have rapidly increased and almost doubled compared to last year. Currently, N costs $0.58/lb to $0.95/lb compared to last year’s price of $0.30/lb to $0.38/lb (Figure 2). Corn prices have increased too, but not as much as fertilizer prices. Currently, corn is selling around $5/bushel for harvest 2022 deliver, while a year ago, harvest 2021 corn was trading around $3.8/bushel.
Commodity prices will continue to fluctuate between now and 2022 harvest. The worst place to end up is with buying high-priced fertilizer while receiving a low price for your crop — i.e., the price/cost squeeze. We strongly recommend forward contracting a portion of your crop when purchasing fertilizer. Having some expected production contracted at current price levels ties you into a stronger farm average price if prices begin to decline.

With the high fertilizer cost compared to last year, the relative cost of accurate fertilizer recommendations based on soil tests is less than the previous years. Assuming the same soil test costs and expected yield for 2021 vs. 2022 crop, UNL recommends a lower N application rate for the 2022 growing season due to the change in the fertilizer price ratio (see Table 1). With a lower fertilizer price ratio of 8:1 for 2022 corn compared to the fertilizer price ratio of 12:1 for last year, the recommended application rate is 23 lbs/acre lower, resulting in a fertilizer savings of $14-22/acre, depending on fertilizer source (see Table 1).
Table 1. Comparison of nitrogen costs and fertilizer recommendation for 2021 and 2022 corn*.| | 2021 | 2022 |
|---|
| Expected Yield (bu/acre) | 220 | 220 |
|---|
| Organic Matter (%) | 2 | 2 |
|---|
| Residual Soil Nitrate (PPM)** | 8,4,3 (0-12, 12-24, 24-36”) | 8,4,3 (0-12, 12-24, 24-36”) |
|---|
| Previous Crop | Corn | Corn |
|---|
| Corn Value ($/bu) | 3.8 | 5.00 |
|---|
| Nitrogen Fertilizer Cost ($/lb) | 0.30 | 0.59 |
|---|
| Corn ($/bu) / N($/lb) Ratio | 12:1 | 8:1 |
|---|
| Recommended N (lb/acre) | 207 | 184 |
|---|
| $ saved per acre | | 14 (anhydrous ammonia) 22 (urea) 21 (32-0-0) |
|---|
| Estimated cost of N fertilizer + application ($/acre) | 72 | 117 |
|---|
| Corn value ($/acre) | 836 | 1100 |
|---|
| Profit ($)/acre*** | 764 | 983 |
|---|
* The recommended rates are calculated using UNL N algorithm, based on anhydrous application.
** Residual nitrate values are averages of soil samples across multiple years submitted to Ward lab.
*** Profit is based on N fertilizer only. Other costs must be included to calculate net profit.
Additionally, by incorporating residual nitrate-nitrogen into the nitrogen fertilizer prescription, there is potential to substantially reduce fertilizer cost per acre. By accounting for residual nitrate-nitrogen in the N fertilizer prescription, growers can save $19-30/acre by crediting 32 lbs N/acre (see Table 2). Note that the UNL calculator factors in a default soil nitrate credit even if no soil test is included. Nevertheless, we recommend using soil nitrate test values for an accurate nitrogen fertilizer prescription.
Another important factor to consider when determining optimal fertilizer rates is proper crediting for other nutrient sources, such as legumes, manure and irrigation water. If fertilizer prices have doubled compared to last year, so has the value of credits from these sources. In the example above, the previous crop was corn. If the previous crop had been soybean, the standard N credit for corn following soybean on a heavy textured soil would be 45 lb/acre with potential savings of $26-43/acre, depending on fertilizer source. The cost to collect and analyze water samples for nitrate content — or manure samples for a range of nutrients — has not changed much, while the value of the nutrients these resources contain has gone up substantially.
Table 2. Comparison of nitrogen fertilizer costs with and without crediting residual soil nitrate*.| | Not accounting residual nitrate | Accounting residual nitrate |
|---|
| Expected Yield (bu/acre) | 220 | 220 |
|---|
| Organic Matter (%) | 2 | 2 |
|---|
| Residual Soil Nitrate (PPM)** | 0 | 8,4,3 (0-12, 12-24, 24-36”) |
|---|
| Previous Crop | Corn | Corn |
|---|
| Corn Value ($) | 5 | 5 |
|---|
| Nitrogen Fertilizer Cost ($) | 0.59 | 0.59 |
|---|
| | 8:1 | 8:1 |
|---|
| Recommended N (lb/acre) | 220 | 188 |
|---|
| $ saved per acre | | 19 (anhydrous ammonia) 30 (urea) 29 (32-0-0) |
|---|
| Estimated cost of N fertilizer + application ($/acre) | 139 | 120 |
|---|
| Corn value ($/acre) | 1100 | 1100 |
|---|
| Profit ($)/acre*** | 961 | 980 |
|---|
* The recommended rates are calculated using UNL N algorithm, based on anhydrous application.
** Residual nitrate values are averages of soil samples across multiple years submitted to Ward lab.
*** Profit is based on N fertilizer only. Other costs must be included to calculate net profit.
Timing of N fertilizer application can also have a high economic impact under high fertilizer prices. Compared to fall fertilizer application, in-season fertilizer management with variable rate technology is expected to have higher economic returns.
Source : unl.edu