By Miranda Reiman
Cattle genetics have made big improvements since the American Angus Association released its beef value ($B) index in 2004.
Often called “dollar beef,” it was one of the first tools to combine expected progeny differences (EPDs) for feedyard and carcass traits with economic measures.
At the time, the breed average was +$23.79, and $45.48 represented the top 1%.
“Now today, we’re three times that, or higher,” says cattle feeder Sam Hands of Triangle H, Garden City, Kan. “So, are the cattle really three times better?”
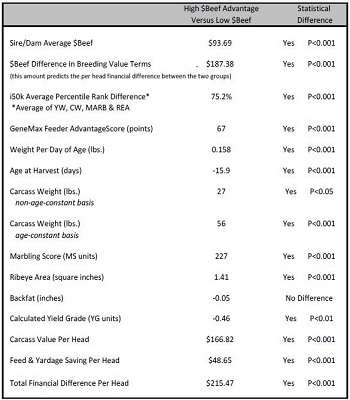
A recent demonstration project, cosponsored by the feedyard along with Gardiner Angus Ranch, Top Dollar Angus and Zoetis, found the resounding “yes” in a $215.47 difference between divergent groups of calves from registered Angus parents.
“High $B Angus outstrip low $B genetics with great consistency. However, we also recognize the importance of real-world comparisons,” say study authors in their summary report, “Field-Testing of $B in Purebred Angus Cattle.”
They created a Low $B group by purchasing older embryos in storage, and used current genetics from Gardiner Angus Ranch to provide High $B comparisons. Random recipient dams calved in a 44-day window in April and May 2015 and raised calves until late fall weaning. By June 2016 they were on feed at Triangle H.
“We were never told, ‘these are the superstars and these are the lesser achievers,’” Hands says, but he could see differences as marketing approached. “The better dollar-beef ($B) cattle were more efficient in reaching that end point quicker, and when they got done were just a little more expressive in their muscling.”
Harvested in three drafts at 0.5-inch backfat, the High $B group was nearly 16 days younger with 27 lb. greater carcass weight. On an age-constant basis, that advantage jumped to 56 lb.
“Not only did they finish quicker, but they also graded better,” Hands says, noting a $48.65/head feed and yardage savings for the higher performing group.
That’s exactly the answer Mark Gardiner was looking for.
“Our customers use the index a great deal and many retain ownership and go all the way through the U.S. Premium Beef system,” he says, suggesting a sole focus on weaning value ($W) is like “quitting football in the third quarter.”
The High $B cattle went 100% Certified Angus Beef ® (CAB®) brand and Prime, with 72% of the latter. The Low $B group made 52% CAB, 44% low Choice and 4% Select because, as the paper suggests, top management, health and nutrition let both groups shine.
“Feedlots don’t want a big surprise, so the more genetic guarantee we can provide, the more comfortable our feedyards are going to be in aggressively bidding on high-genetic Angus calves,” says Kenny Stauffer, Top Dollar Angus general manager. “Even if they have to pay more, in the end those calves produce greater profits for the cattle feeder.”
The pedigree $B varied $93.69, but that doubles in the “estimated breeding value” for progeny, to $187.38 (see table). The actual data bested that by more than $28, coming in at that $215.47.

“The EPDs and indexes are not just numbers on a page in a sale catalog; they’re very accurate tools that people can use,” Stauffer says.
Genomic predictions followed as expected, with an average GeneMax® Advantage™ Feeder score of 94 out of a 100-point scale for the High $B group, compared to 27 for the lower ones. The i50k test for yearling weight, carcass weight, marbling and ribeye showed the High $B cattle in the top 12.3% of the Angus breed, while the Low $B were in the bottom 12.5%.
The data points to all the advantages of selecting for more feedyard performance and carcass quality, yet many argue the cattle owner at harvest reaps all the benefits.
“The bulls we use are in the top 5% for dollar weaning ($W) also, but it’s very short-sighted to stop at that point,” Gardiner says. “Even if you sell at weaning, the guys that are buying those are not going to buy them again if they don’t perform in the feedlot and on the rail.”
Both groups were exactly the same in mature height though the High $B half were about 66 lb. heavier, and there was a $32.76 difference in the cow energy value ($EN), favoring the Low $B group.
Gardiner explains that having high-growth males automatically hurts the $EN figure. If a female is taking up too many resources, she’ll come up open—a clue she can’t perform in that nutritional scheme, he says.
The paper notes annual cow feed costs could be $65.52 higher for the better performing group. Subtracting that from the financial advantage of the progeny still gives the High $B nearly a $150-per-head advantage.
“We all want low-input cattle, but we sell outputs for a living,” Gardiner says. In the end, net profit favors the more productive, higher quality cattle.
“There’s not an Angus calf born out there that shouldn’t be destined to be efficient in the feedyard and hang up the value-added carcass on the rail,” he says.