By Dwight Raab and Bradley Zwilling et.al
This article examines the trends in annual working capital for Illinois grain farms, using data from the Illinois Farm Business Farm Management (FBFM) and building upon our recent analyses on farm liquidity (see farmdoc daily, October 31, 2024, December 4, 2023). Liquidity describes a farm business’s ability to generate sufficient cash or to quickly convert assets into cash to meet its financial obligations as they come due, which include unfinanced capital purchases, operational expenses, debt payments, family living expenses, and taxes. While there are several liquidity measures, our focus here is on working capital. This metric is defined as the difference between current assets (i.e., cash and assets expected to be converted into cash within the next 12 months, including accounts receivable, inventory, and prepaid expenses) and current liabilities (i.e., obligations due within the next 12 months, such as accounts payable, short-term loans, and upcoming taxes). In our analysis, we report the annual median current assets and current liabilities of grain farms in Illinois. We then use these values to calculate the implied value of working capital in that year, along with the median reported working capital. This approach will allow us to discuss the relative changes in median current assets and liabilities driving the working capital trends.
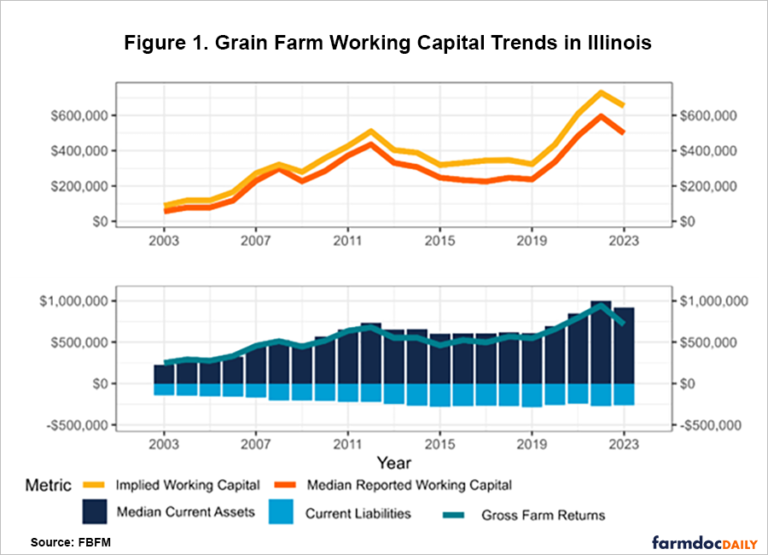
Over the past two decades, Illinois grain farms have substantially increased their working capital, with the sharpest rise occurring between 2019 and 2022, as illustrated in Figure 1. The working capital trend closely mirrors the accrual net farm income trend. From 2003 to 2006, incomes gradually increased, followed by a sharper rise from 2007 to 2013, driven by high commodity prices associated with increased corn demand for ethanol and export market growth for soybeans. Despite the widespread drought in 2012, which could have further negatively impacted incomes and liquidity, crop insurance and higher prices mitigated these effects. From 2013 to 2019, incomes decreased due to lower crop prices and higher costs. However, incomes rebounded from 2020 to 2022, peaking in 2022, making it the highest income year on record. Farm incomes were much lower in 2023 compared to 2022, resulting in a slight decline in financial positions for Illinois farms (see farmdoc daily, October 18, 2024).

When examining how working capital has changed over this period, it is evident that Illinois grain farms have strengthened their working capital positions by significantly increasing their current assets relative to their current liabilities. For example, the rise in implied working capital from $87,477 in 2003 to $509,774.50 in 2012, a 482.75% increase, was driven by median current assets rising from $227,968 to $732,583.50, a 221.35% increase, while median current liabilities rose from $140,491 to $222,809, a 58.59% increase, over the same period. The median reported working capital increased by 675.47%, rising from $56,092 to $434,974. In subsequent years, current liabilities continued to rise while current assets reversed their trend and fell, resulting in a decline in working capital. The 2015 to 2019 period was somewhat flat since the value of median current assets relative to median current liabilities did not change by much. However, median current assets rose dramatically from $610,805 in 2019 and peaked at $1,000,946 in 2022, a 63.87% rise, while median current liabilities declined by 5.28% from $287,353 to $272,184. Consequently, the implied working capital rose from $323,452 to $728,762 in that period, a 125.31% rise. The median reported working capital grew by 150.76%, from $237,265 in 2019 to $594,966 in 2022. In 2023, median current assets declined by 8.49% to $915,934, while median current liabilities declined by 3.33% to $263,109, resulting in the implied working capital declining by 10.42% to $652,825. The reported median working capital declined by 16.35% to $497,687.
Conclusion
Our analysis of working capital trends reveals significant improvements in liquidity positions over the past two decades, driven primarily by commodity price cycles and their impact on current assets, particularly grain inventory values. The most notable increases occurred during the 2019-2022 period, when median working capital more than doubled. These improvements in working capital positions have strengthened the liquidity of Illinois grain farms. However, the 2023 decline in working capital, while modest relative to historical levels, serves as a reminder that farm liquidity positions remain sensitive to commodity market conditions and input costs. Looking ahead, maintaining strong working capital positions will be crucial for Illinois grain farms to manage financial risks effectively and capitalize on market opportunities.
Acknowledgment
The authors would like to acknowledge that data used in this study comes from the Illinois Farm Business Farm Management (FBFM) Association. Without Illinois FBFM, information as comprehensive and accurate as this would not be available for educational purposes. FBFM, which consists of 5,000+ farmers and 70 professional field staff, is a not-for-profit organization available to all farm operators in Illinois. FBFM field staff provide on-farm counsel along with recordkeeping, farm financial management, business entity planning and income tax management. For more information, please contact our office located on the campus of the University of Illinois in the Department of Agricultural and Consumer Economics at 217-333-8346 or visit the FBFM website at www.fbfm.org.
Source : illinois.edu