By Edward Martey, Peter Goldsmith.et.al
USAID’s Feed the Future Lab for Soybean Value Chain Research, aka the Soybean Innovation Lab (SIL), is a research for development project begun in 2013. The team of 40 US researchers work in 17 countries, most of which are in Sub-Saharan Africa. The University of Illinois is the lead institution, accompanied by the University of Missouri and Mississippi State University. Recently, farmdoc asked SIL to provide a series of articles describing the state of soybean development in Sub-Saharan Africa. This series of articles describes the current state of soybean in Africa from the multiple disciplines that comprise the Soybean Innovation Lab.
The previous farmdoc daily articles in this series were published on
July 31, 2019, August 7, 2019, August 8, 2019,
August 9, 2019,
August 14, 2019,
August 21, 2019 and
August 28, 2019.
Obtaining soybean price data at either the farm gate or wholesale levels remains elusive in Sub-Saharan Africa because markets are immature, the crop is new, and data collection is relatively costly. Additionally, regional within-country price data are especially hard to obtain. Thus, formal price analyses of commodity markets in Sub-Saharan Africa are scarce and none to date involve soybean. Recently, we obtained access to a unique soybean price dataset in Ghana that helps provide some of the first insights into commercial crop price behavior in Sub-Saharan Africa. In this article, we share an overview of soybean prices in Ghana; however, a more technical analysis of pricing behavior appears in Martey et al, 2019.
Soybean production is a relatively new crop in Ghana and cultivated mostly by smallholder farmers under rain-fed conditions (MiDA, 2010; Akramov & Malek, 2012). The average area cultivated to soybean is less than two acres. Current domestic supply lags behind domestic demand by an estimated two thirds, and thus requires significant imports of soybean grain, meal, and oil (Gage et al., 2012; Eshun et al, 2018). The Northern region alone contributes about 77 percent of national production (SRID, 2012). National soybean production shows growth in Ghana since 2012 (SRID, 2015). Poultry and small-scale processing firms, as well as rising food oil demand, account for the expansion of production (Gage et al., 2012). Both the post-harvest committee and the National Food Buffer Stock Company, both government agencies tasked with price and supply stabilization, have been active in maize and rice markets, but are absent from the relatively nascent soybean sector.
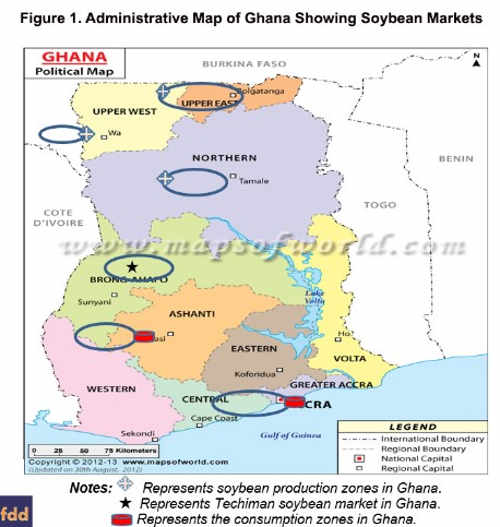
The local price data covers the six major regions of Ghana; 1) Upper West, 2) Upper East, 3) Northern, 4) Brong-Ahafo, 5) Ashanti, and 6) Greater Accra (Figure 1) from 2011 to 2017. The first three markets are located in the northern three regions of Ghana. Techiman and Kumasi are located in the middle belt whereas the Accra location is in the southern coastal part of Ghana. The center of soybean production takes place in the Northern Region while utilization occurs in the middle Ashanti and southern greater Accra regions.

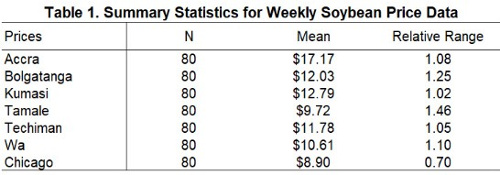
The mean prices of soybean at all locations during the study period vary between 8.90 – 17.17 US$/bu. The average price, in decreasing order, of soybean per bushel in Accra is 17.17 US$/bu followed by Kumasi (12.79 US$/bu), Bolgatanga (12.03 US$/bu), Techiman (11.78 US$/bu), Wa (10.61 US$/bu), Tamale (9.72 US$/bu), and Chicago (8.90 US$/bu) (Table 1). Thus, prices in Ghana, when measured at regional centers, are not “low” relative to international prices. The Chicago price does not reflect landed costs in Ghana. However, should domestic production expand to meet demand, it appears that Ghanaian farmers could be competitive with imports.

Using the coefficient of variation (CV), we find that prices in Tamale, the center of production, present the largest deviation from the mean of .35, followed by two other northern cities Bolgatanga (.30) and Wa (.28). The lowest CVs are Kumasi (.25), Accra (.24), Techiman (.23), and Chicago (.19). The results imply that the relative price of soybean in the industrial regions of Ghana do not fluctuate widely among the analyzed markets within the period of study. The coefficient of variation compares favorably to the international market, especially in the industrial markets in the center and southern part of the country. However, the near double CV of the main producing area of Tamale reflects the lack of storage, weak infrastructure, and relatively high distances to markets.
The CV results are consistent with the relative price range, which is the ratio of the price range to the mean price. A comparison of the relative price ratios shows that Tamale at a relative range of 1.46 is significantly higher than all other markets, even the other northern markets (Table 1). This reflects that high production and low utilization in the Northern region, whereby supply is high at harvest, drives down prices, and then sustains relatively higher prices in the off season due to limited storage and carryover in the country, limited domestic supply, and a relatively high cost of dollar-based soybean, meal, and food oil imports.
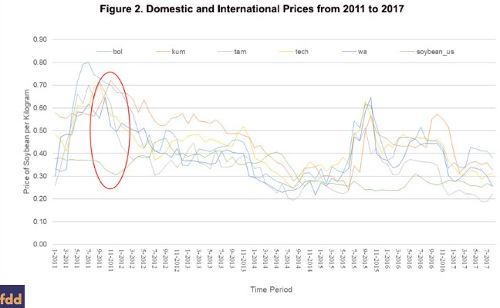
The visual presentation in Figure 2 shows, as expected, the Tamale price often riding at or below the Chicago price because it serves as the nation’s production region. The industrial central region, reflected by Kumasi and Techiman, shows opposite results with consistently higher prices relative to the Chicago price. Interestingly, Bolgatanga on the border with Burkina Faso shows relatively strong prices even though it lies only 104 miles away from Tamale. The relatively high price reflects the high demand and low supply conditions of Burkina Faso, the relatively weak transportation infrastructure between Bolgatanga and Tamale, and the high level of buy-side competition for Tamale’s annual production between buyers in the north and central regions. Finally, the visual presentation does show two periods, pre-harvest 2011 and 2015, where Ghanaian prices separate from the international price. This reflects the relative slowness of the Ghanaian harvest that is completely unmechanized, and the poor storage and transport infrastructure that can isolate for brief periods of Ghana’s agro-industrial center.

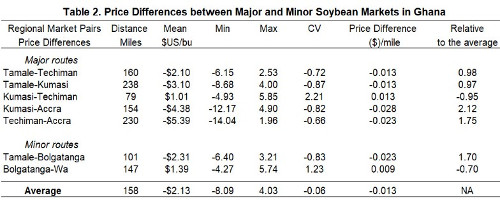
We identify five major and two minor trade routes involving the six selected market locations that capture the bulk of Ghana’s soybean trade (Table 2). All the mean price spreads were negative except the adjacent markets of Bolgatanga-Wa and Kumasi-Techiman. The Tamale and Kumasi market pair lie the farthest apart, at 238 miles, among the regional market pairs, followed by Techiman-Accra (230 miles). Kumasi-Techiman, two industrial neighbors, are the closest (79 miles) regional market pair. As expected, the farthest market pairs experience relatively higher absolute mean price spread compared to adjacent markets. For example, in absolute terms, Techiman and Accra recorded a mean spread of $5.39 US/bu while the closest market pair (Kumasi-Techiman) recorded a mean price spread of $1.01 US/bu in absolute terms. The coefficient of variation (2.21) though indicates that these two adjoining central agro-industrial cities have high price dispersion from the mean price spread. This departs from our expectation given that the information flow across such markets should be rapid. However, the price per mile of distance travelled across the three key grain transport routes (Tamale-Techiman, Tamale-Kumasi, and Kumasi-Techiman) are relatively consistent, $.013 USD. There appears to be relatively good information flow across these key market pairs.

The ratio of mean soybean price to distance in the Bolgatanga-Wa market pair is the lowest (.70) in absolute terms relative to the other regional market pairs. The secondary demand markets of Accra (far south) and Bolgatanga (far north) present significantly higher price differences per mile, as expected, as they compete with buyers from the agro-industrial center of the country (Kumasi and Techiman).
In sum, the traditional concern of low prices relative to international prices appears to be unwarranted. However, we use in our research regional market prices, not prices found at the farm gate itself. Smallholders producing small quantities, possibly combined with poor quality, limited storage, cash sales at harvest, and long distances from buying centers, will raise transaction costs and basis spreads. In addition, our research shows smallholder production inefficiencies due to low yields excessively raises costs per bushel as to potentially make small holders noncompetitive. The guidance for policy makers is not to confound regional price performance and integration with international markets with the challenges small holders face from poor scale economies, weak infrastructure, and low yields.