Overview
Corn, soybeans, cotton, and wheat were down for the week.
On Tuesday, the USDA released its annual Prospective Plantings report. The report projected an increase in principle crop acreage nationally of 16.462 million acres year-over-year to 319.088 million acres. This projection assumes a return to “normal” prevented planting acres in 2020. 2019 had abnormally high prevented planting acres at 19.6 million acres (11.4 million acres of corn; 0.464 million acres of cotton; 4.46 million acres of soybeans; and 2.22 million acres of wheat), so the year-over-year increase in total acres needs to be cautiously interpreted.
Tennessee’s principle crop area planted is projected at 5.023 million acres, up 187,000 compared to 2019. Prevented planting in Tennessee was not nearly as bad as many areas in the country, however Lauderdale, Dyer, Lake, and Gibson all had over 20,000 acres prevented planted in 2019.
National (Tennessee) corn, cotton, soybean, and wheat planted area was projected at: 96.99 (1.04) million acres; 13.703 (0.36) million acres; 83.51 (1.5) million acres; and 44.655 (0.31) million acres. Year-over-year increases in projected planted acreage by crop, nationally (Tennessee) were: corn up 8.1% (up 7.2%); soybeans up 9.7% (up 7.1%); cotton down <1% (down 12.2%); and wheat down 1.1% (up 10.7%). Wheat was the only Tennessee commodity that did not track the national direction for commodity acreage. This was largely attributed to the reduction of last years planted acres due to a wet fall in several key wheat producing counties.
Market reaction to the USDA report was limited as other factors (COVID-19 and the economic fallout) are currently dominating the direction and movements of commodity futures markets. However, the report does provide an initial baseline for adjustments to U.S. and Tennessee planted acres. Moving forward planting conditions will begin to influence markets as weather will determine if prevented planted acres return to normal (approximately 4.6 million acres) or are closer to the 19.6 million acres last year. How many acres are planted will go a long way in determining potential production for the 2020 crop year.
Corn
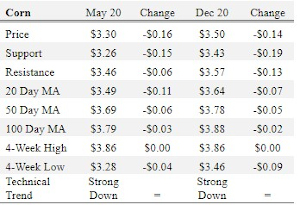
Ethanol production for the week ending March 27 was 0.84 million barrels per day, down 165,000 barrels from the previous week. Ethanol stocks were 25.717 million barrels, up 1.577 million barrels compare to last week. Corn net sales reported by exporters for March 20-26 were down compared to last week with net sales of 42.3 million bushels for the 2019/20 marketing year and 0.8 million bushels for the 2020/21 marketing year. Exports for the same time period were up 49% from last week at 49.5 million bushels. Corn export sales and commitments were 73% of the USDA estimated total exports for the 2019/20 marketing year (September 1 to August 31) compared to the previous 5-year average of 81%. Across Tennessee, average corn basis (cash price-nearby futures price) weakened at Northwest Tennessee and strengthened at Memphis, Northwest Barge Points, and Upper-middle Tennessee. Overall, basis for the week ranged from 11 under to 26 over, with an average of 14 over the May futures at elevators and barge points. May 2020 corn futures closed at $3.30, down 16 cents since last Friday. For the week, May 2020 corn futures traded between $3.28 and $3.46. May/Jul and May/Dec future spreads were 6 and 20 cents. July 2020 corn futures closed at $3.36, down 15 cents since last Friday.

In Tennessee, new crop cash corn contracts ranged from $3.25 to $3.60. December 2020 corn futures closed at $3.50, down 14 cents since last Friday. Downside price protection could be obtained by purchasing a $3.60 December 2020 Put Option costing 28 cents establishing a $3.32 futures floor.
Soybeans
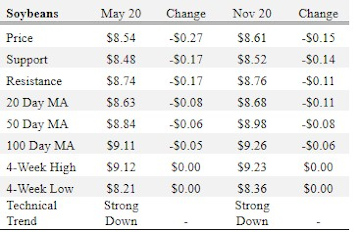
Net sales reported by exporters were up compared to last week with net sales of 35.2 million bushels for the 2019/20 marketing year and 4.2 million bushels for the 2020/21 marketing year. Exports for the same period were down 23% compared to last week at 17.2 million bushels. Soybean export sales and commitments were 74% of the USDA estimated total annual exports for the 2019/20 marketing year (September 1 to August 31), compared to the previous 5-year average of 92%. Average soybean basis strengthened at Northwest Barge Points, Memphis, Northwest, and Upper-middle Tennessee. Basis ranged from 15 under to 30 over the May futures contract at elevators and barge points. Average basis at the end of the week was 22 over the May futures contract. May 2020 soybean futures closed at $8.54, down 27 cents since last Friday. For the week, May 2020 soybean futures traded between $8.50 and $8.92. May/Jul and May/Nov future spreads were 5 and 7 cents. July 2020 soybean futures closed at $8.59, down 26 cents since last Friday. May soybean-to-corn price ratio was 2.59 at the end of the week.

In Tennessee, new crop soybean cash contracts ranged from $8.26 to $8.91. Nov/Dec 2020 soybean-to-corn price ratio was 2.46 at the end of the week. November 2020 soybean futures closed at $8.61, down 15 cents since last Friday. Downside price protection could be achieved by purchasing an $8.80 November 2020 Put Option which would cost 51 cents and set an $8.29 futures floor.
Cotton
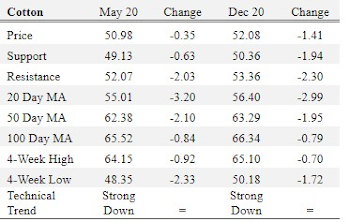
Net sales reported by exporters were down compared to last week with net sales of 147,500 bales for the 2019/20 marketing year and 111,400 bales for the 2020/21 marketing year. Exports for the same time period were up 4% compared to last week at 400,800 bales. Upland cotton export sales were 100% of the USDA estimated total annual exports for the 2019/20 marketing year (August 1 to July 31), compared to the previous 5-year average of 94%. Delta upland cotton spot price quotes for April 2 were 46.24 cents/lb (41-4-34) and 48.49 cents/lb (31-3-35). Adjusted World Price (AWP) decreased 2.36 cents to 42.63 cents. May 2020 cotton futures closed at 50.98 cents, down 0.35 cents since last Friday. For the week, May 2020 cotton futures traded between 48.35 and 51.73 cents. May/Jul and May/Dec cotton futures spreads were 0 cents and 1.1 cents. July 2020 cotton futures closed at 50.98 cents, down 0.3 cents since last Friday.

December 2020 cotton futures closed at 52.08, down 1.41 cents since last Friday. Downside price protection could be obtained by purchasing a 53 cent December 2020 Put Option costing 5.9 cents establishing a 47.1 cent futures floor.
Wheat
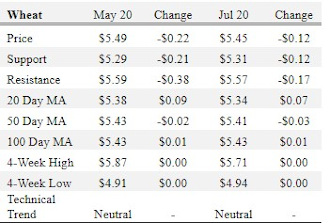
Wheat net sales reported by exporters were down compared to last week with net sales of 2.7 million bushels for the 2019/20 marketing year and 6.8 million bushels for the 2020/21 marketing year. Exports for the same time period were down 34% from last week at 10.0 million bushels. Wheat export sales were 91% of the USDA estimated total annual exports for the 2019/20 marketing year (June 1 to May 31), compared to the previous 5-year average of 101%. May 2020 wheat futures closed at $5.49, down 22 cents since last Friday. May 2020 wheat futures traded between $5.38 and $5.80 this week. May wheat-to-corn price ratio was 1.66. May/Jul and May/Sep future spreads were -4 and -2 cents.

In Tennessee, June/July 2020 cash contracts ranged from $5.44 to $5.99. July 2020 wheat futures closed at $5.45, down 12 cents since last Friday. Downside price protection could be obtained by purchasing a $5.50 July 2020 Put Option costing 32 cents establishing a $5.18 futures floor. July wheat-to-corn price ratio was 1.62. September 2020 wheat futures closed at $5.47, down 9 cents since last Friday.
Source : tennessee.edu