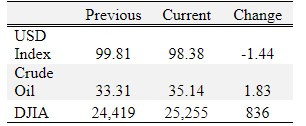
Overview
Corn, soybeans, and wheat were up; and cotton was down for the week.
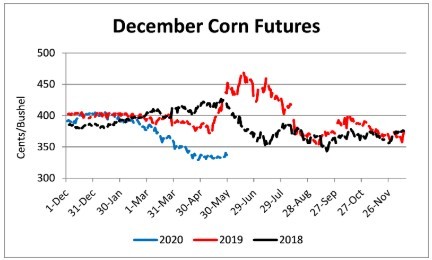
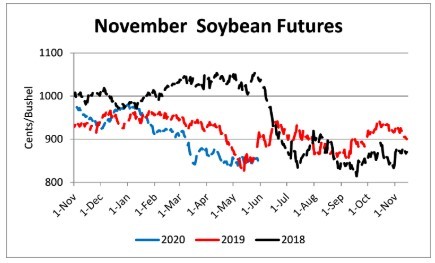
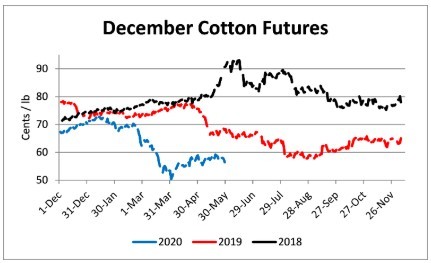
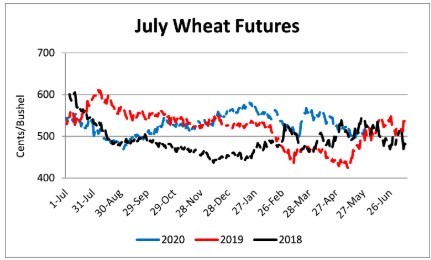
The COVID-19 pandemic has had a dramatic effect on commodity prices and agricultural supply chains. However, the end of May saw a modest recovery in futures prices. December corn had a contract low of $3.25 ½ on April 21 and closed May at $3.38 ¾, up 13 ¼ cents. November soybeans bottomed at $8.31 on April 21 and closed May at $8.51 ¾, up 20 ¾ cents. December cotton established a contract low at 50.18 on April 2 and closed May at 57.48, up 7.3 cents. July wheat established a 6-month low on May 18 of $4.93 ¾ and closed May at $5.20 ¾, up 27 cents. While these prices are unlikely to be attractive to producers, setting a firm bottom in the futures market is an important step for prices to move higher.
If prices move higher, producers will need to act quickly to take advantage of improved prices as the lack of pricing opportunities this spring, for the 2020 crop, has condensed the marketing window for most producers. To determine what prices producers should consider selling their crops at they will need to evaluate cost of production (to determine their investment in the growing crop), storage capacities (to determine how much will be priced between now and harvest and how much can be priced through the remainder of 2020 and into 2021), and evaluate potential payments through government programs. For the 2018, 2019, and likely 2020 crops the path to profitability or at least minimizing losses has been reliant on government payments from ARC/PLC, MFP, Crop Insurance, and CFAP. Understanding and using these programs to minimize risk and maximize payments in these difficult times is essential for all producers. Seeking advice from your financial management advisors (banker, crop insurance agent, Extension personnel, accountant, and lawyer) is strongly recommended due to the complexity of these programs.
CFAP enrollment opened May 26 and will conclude August 28. CFAP applications are being accepted at USDA FSA service centers. Producers with eligible corn, soybean, and cotton old crop inventories (plus any other eligible commodities) should organize their inventory and sales records and then call their service center to complete an application or visit www.farmers.gov/cfap.
Corn
Ethanol production for the week ending May 22 was 0.724 million barrels per day, up 61,000 barrels from the previous week. Ethanol stocks were 23.176 million barrels, down 0.450 million barrels compare to last week. Corn net sales reported by exporters for May 15-21 were down compared to last week with net sales of 16.8 million bushels for the 2019/20 marketing year and 1.8 million bushels for the 2020/21 marketing year. Exports for the same time period were down 16% from last week at 41.8 million bushels. Corn export sales and commitments were 88% of the USDA estimated total exports for the 2019/20 marketing year (September 1 to August 31) compared to the previous 5-year average of 95%. Across Tennessee, average corn basis (cash price-nearby futures price) strengthened or remained unchanged at Memphis, Northwest Barge Points, and Northwest Tennessee and weakened at Upper-middle Tennessee. Overall, basis for the week ranged from 11 under to 24 over, with an average of 9 over the July futures at elevators and barge points. July 2020 corn futures closed at $3.258, up 7 cents since last Friday. For the week, July 2020 corn futures traded between $3.16 and $3.30. Jul/Sep and Jul/Dec future spreads were 5 and 13 cents.
Corn | Jul 20 | Change | Dec 20 | Change |
Price | $3.25 | $0.07 | $3.38 | $0.06 |
Support | $3.14 | $0.00 | $3.29 | $0.00 |
Resistance | $3.37 | $0.17 | $3.48 | $0.13 |
20 Day MA | $3.19 | $0.02 | $3.34 | $0.01 |
50 Day MA | $3.28 | -$0.03 | $3.42 | -$0.03 |
100 Day MA | $3.57 | -$0.03 | $3.65 | -$0.03 |
4-Week High | $3.30 | -$0.01 | $3.42 | -$0.01 |
4-Week Low | $3.12 | $0.03 | $3.30 | $0.01 |
Technical Trend | Down | = | Down | + |
Nationally the Crop Progress report estimated corn condition at 70% good-to-excellent and 5% poor-to-very poor; corn planting at 88% compared to 80% last week, 55% last year, and a 5-year average of 82%; and corn emerged at 64% compared to 43% last week, 28% last year, and a 5-year average of 58%. In Tennessee, the Crop Progress report estimated corn condition at 67% good-to-excellent and 5% poor-to-very poor; corn planted at 86% compared to 79% last week, 91% last year, and a 5-year average of 95%; and corn emerged at 71% compared to 60% last week, 78% last year, and a 5-year average of 85%. In Tennessee, new crop cash corn contracts ranged from $3.07 to $3.38. September 2020 corn futures closed at $3.30, up 8 cents since last Friday. December 2020 corn futures closed at $3.38, up 6 cents since last Friday. Downside price protection could be obtained by purchasing a $3.40 December 2020 Put Option costing 22 cents establishing a $3.18 futures floor.
Soybeans
Net sales reported by exporters were down compared to last week with net sales of 23.7 million bushels for the 2019/20 marketing year and 7.5 million bushels for the 2020/21 marketing year. Exports for the same period were down 34% compared to last week at 12.2 million bushels. Soybean export sales and commitments were 92% of the USDA estimated total annual exports for the 2019/20 marketing year (September 1 to August 31), compared to the previous 5-year average of 98%. Average soybean basis weakened or remained unchanged at Memphis, Northwest Barge Points, Northwest, and Upper-middle Tennessee. Basis ranged from 24 under to 23 over the July futures contract at elevators and barge points. Average basis at the end of the week was 9 over the July futures contract. July 2020 soybean futures closed at $8.40, up 7 cents since last Friday. For the week, July 2020 soybean futures traded between $8.32 and $8.52. Jul/Aug and Jul/Nov future spreads were 3 and 11 cents. August 2020 soybean futures closed at $8.43, up 7 cents since last Friday. July soybean-to-corn price ratio was 2.58 at the end of the week.
Soybeans | Jul 20 | Change | Nov 20 | Change |
Price | $8.40 | $0.07 | $8.51 | $0.07 |
Support | $8.32 | $0.10 | $8.42 | $0.06 |
Resistance | $8.59 | $0.15 | $8.65 | $0.12 |
20 Day MA | $8.43 | $0.02 | $8.50 | $0.02 |
50 Day MA | $8.53 | $0.01 | $8.56 | $0.00 |
100 Day MA | $8.83 | -$0.05 | $8.88 | -$0.05 |
4-Week High | $8.61 | $0.00 | $8.65 | $0.00 |
4-Week Low | $8.28 | $0.00 | $8.38 | $0.01 |
Technical Trend | Strong Down | = | Down | + |
Nationally the Crop Progress report estimated soybean planting at 65% compared to 53% last week, 26% last year, and a 5-year average of 55%; and soybeans emerged at 35% compared to 18% last week, 9% last year, and a 5-year average of 27%. In Tennessee, soybeans planted were estimated at 39% compared to 29% last week, 44% last year, and a 5-year average of 48% and soybeans emerged at 21% compared to 14% last week, 24% last year, and a 5-year average of 26%. In Tennessee, new crop soybean cash contracts ranged from $8.19 to $8.70. Nov/Dec 2020 soybean-to-corn price ratio was 2.52 at the end of the week. November 2020 soybean futures closed at $8.51, up 7 cents since last Friday. Downside price protection could be achieved by purchasing an $8.60 November 2020 Put Option which would cost 41 cents and set an $8.19 futures floor.
Cotton
Net sales reported by exporters were down compared to last week with net sales of 44,600 bales for the 2019/20 marketing year and 171,900 bales for the 2020/21 marketing year. Exports for the same time period were up 6% compared to last week at 267,400 bales. Upland cotton export sales were 117% of the USDA estimated total annual exports for the 2019/20 marketing year (August 1 to July 31), compared to the previous 5-year average of 104%. Delta upland cotton spot price quotes for May 28 were 54.82 cents/lb (41-4-34) and 57.07 cents/lb (31-3-35). Adjusted World Price (AWP) decreased 0.53 cents to 47.48 cents. July 2020 cotton futures closed at 57.59 cents, down 0.02 cents since last Friday. For the week, July 2020 cotton futures traded between 56.56 and 59.45 cents. Jul/Dec and Jul/Mar cotton futures spreads were 0.89 cents and -0.11 cents.
Cotton | Jul 20 | Change | Dec 20 | Change |
Price | 57.59 | -0.02 | 57.48 | -0.33 |
Support | 56.87 | 0.39 | 56.97 | 0.30 |
Resistance | 58.89 | 0.11 | 58.45 | -0.92 |
20 Day MA | 57.04 | 0.31 | 57.60 | -0.08 |
50 Day MA | 54.85 | -0.08 | 56.14 | -0.15 |
100 Day MA | 61.37 | -0.54 | 61.92 | -0.54 |
4-Week High | 59.35 | -0.50 | 59.59 | 0.00 |
4-Week Low | 53.20 | 0.00 | 55.11 | 0.00 |
Technical Trend | Flat | - | Down | = |
Nationally, the Crop Progress report estimated cotton planted at 53%, compared to 44% last week, 53% last year, and a 5-year average of 53%. In Tennessee, cotton planted was estimated at 47% compared to 23% last week, 68% last year, and a 5-year average of 74%. December 2020 cotton futures closed at 57.48, down 0.33 cents since last Friday. Downside price protection could be obtained by purchasing a 58 cent December 2020 Put Option costing 4.61 cents establishing a 53.39 cent futures floor. March 2021 cotton futures closed at 58.48 cents, down 0.25 cents since last Friday.
Wheat
Wheat net sales reported by exporters were up compared to last week with net sales of 7.7 million bushels for the 2019/20 marketing year and 18.2 million bushels for the 2020/21 marketing year. Exports for the same time period were up from last week at 20.6 million bushels. Wheat export sales were 101% of the USDA estimated total annual exports for the 2019/20 marketing year (June 1 to May 31), compared to the previous 5-year average of 106%.
Wheat | Jul 20 | Change | Sep 20 | Change |
Price | $5.20 | $0.12 | $5.23 | $0.11 |
Support | $5.07 | $0.11 | $5.11 | $0.11 |
Resistance | $5.28 | $0.06 | $5.31 | $0.07 |
20 Day MA | $5.11 | -$0.03 | $5.14 | -$0.03 |
50 Day MA | $5.31 | $0.01 | $5.34 | $0.01 |
100 Day MA | $5.38 | -$0.02 | $5.43 | -$0.02 |
4-Week High | $5.28 | -$0.24 | $5.30 | -$0.24 |
4-Week Low | $4.93 | $0.00 | $4.97 | $0.00 |
Technical Trend | Down | = | Down | - |
Nationally the Crop Progress report estimated winter wheat condition at 54% good-to-excellent and 16% poor-to-very poor; winter wheat headed at 68% compared to 56% last week, 63% last year, and a 5-year average of 72%; spring wheat planted at 81% compared to 60% last week, 80% last year, and a 5-year average of 90%; and spring wheat emerged at 51% compared to 30% last week, 41% last year, and a 5-year average of 65%. In Tennessee, winter wheat condition was estimated at 59% good-to-excellent and 6% poor-to-very poor; winter wheat headed at 100% compared to 99% last week, 98% last year, and a 5-year average of 98%; and winter wheat coloring at 46% compared to 16% last week, 54% last year, and a 5-year average of 47%. In Tennessee, June/July 2020 cash contracts ranged from $4.85 to $5.40. July 2020 wheat futures closed at $5.20, up 12 cents since last Friday. July 2020 wheat futures traded between $5.01 and $5.22 this week. July wheat-to-corn price ratio was 1.60. Jul/Sept and Jul/Jul future spreads were 3 and 18 cents. September 2020 wheat futures closed at $5.23, up 11 cents since last Friday. September wheat-to-corn price ratio was 1.58. July 2021 wheat futures closed at $5.38, up 9 cents since last Friday. Downside price protection could be obtained by purchasing a $5.40 July 2021 Put Option costing 44 cents establishing a $4.96 futures floor.
Source : tennessee.edu