Overview
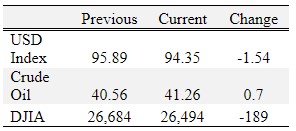
Soybeans and wheat were up; corn and cotton were down for the week.
Large corn and soybean purchases by China were reported in this week’s USDA export sales highlights (week of July 10-16). China purchased 77.16 and 54.6 million bushels of new crop (2020/21 marketing year) corn and soybeans. The export sales are positive, however the relationship between the U.S. and China remains unpredictable. This week, the U.S. ordered the closure of China’s consulate in Houston and China responded by closing the U.S consulate in Chengdu. Agricultural commodities are trapped by the uncertainty, even with the recent strong export sales. Until Brazil finishes harvesting its second crop corn and plants soybeans and first crop corn -- starting in September, China will likely continue buying U.S. supplies. Once South American production can be more easily estimated (ready for export sales), we will learn a lot more about how serious China is about living up to its commitments in the Phase 1 trade agreement. Right now it’s difficult to see a path where China is able to fully meet it’s agreed upon agricultural purchases.
Overall, weather and crop conditions remain supportive to production. Currently, many analysts are projecting at or slightly above trend line national average yield (approximately 178-182 bu/acre). There is still time for adverse weather to limit corn yield but as we move into August yield becomes more certain. For soybeans, August weather will dictate how yields will finish. Current yield and production estimates are not supportive for higher prices, particularly with the trade and COVID-19 demand uncertainty.
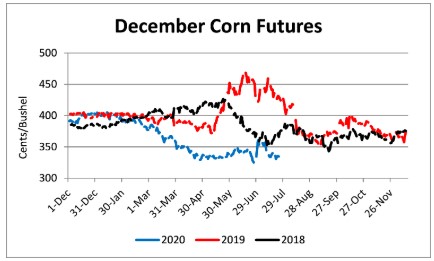
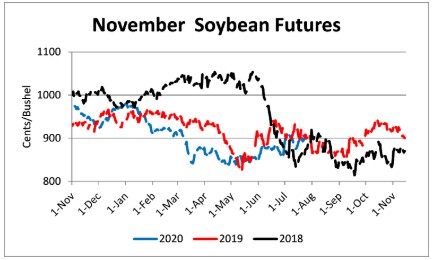
December corn futures have been trading between $3.20 and $3.65 since early April. Based on current information there is no reason to believe we will deviate from this range in the near future. November soybean futures strengthened from $8.40 and $9.00 over the past two months, however significant resistance exists near $9.20.
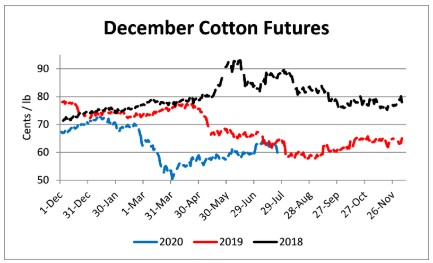
December cotton futures have retreated almost 5 cents in the past two weeks after approaching 65 cents. Demand uncertainty, due to trade with China and global economic recovery from COVID-19, combined with 7.1 million bales carried over from last year’s crop, into the current market year, will continue to limit prices. A 57 to 64 cent futures price range remains likely.
Corn
Ethanol production for the week ending July 17 was 0.908 million barrels per day, down 23,000 barrels from the previous week. Ethanol stocks were 19.801 million barrels, down 0.807 million barrels compared to last week. Corn net sales reported by exporters for July 10-16 were up compared to last week with net sales of 8.7 million bushels for the 2019/20 marketing year and 91.6 million bushels for the 2020/21 marketing year. Exports for the same time period were up 4% from last week at 41.4 million bushels. Corn export sales and commitments were 97% of the USDA estimated total exports for the 2019/20 marketing year (September 1 to August 31) compared to the previous 5-year average of 102%. Across Tennessee, average corn basis (cash price-nearby futures price) weakened at Upper-middle Tennessee and strengthened at Memphis, Northwest Barge Points, and Northwest Tennessee. Overall, basis for the week ranged from 1 under to 34 over, with an average of 16 over the September futures at elevators and barge points. September 2020 corn futures closed at $3.26, down 7 cents since last Friday. For the week, September 2020 corn futures traded between $3.22 and $3.33. Sep/Dec and Sep/Mar future spreads were 9 and 20 cents.
Corn | Sep 20 | Change | Dec 20 | Change |
Price | $3.26 | -$0.07 | $3.35 | -$0.04 |
Support | $3.23 | -$0.05 | $3.30 | -$0.05 |
Resistance | $3.32 | -$0.05 | $3.39 | -$0.04 |
20 Day MA | $3.34 | $0.00 | $3.42 | $0.00 |
50 Day MA | $3.31 | $0.00 | $3.39 | $0.00 |
100 Day MA | $3.37 | -$0.02 | $3.45 | -$0.03 |
4-Week High | $3.55 | $0.00 | $3.63 | $0.00 |
4-Week Low | $3.15 | $0.00 | $3.22 | $0.00 |
Technical Trend | Down | - | Down | = |
Nationally the Crop Progress report estimated corn condition at 69% good-to-excellent and 8% poor-to-very poor; corn silking at 59% compared to 29% last week, 30% last year, and a 5-year average of 54%; and corn dough at 9% compared to 3% last week, 4% last year, and a 5-year average of 7%. In Tennessee, the Crop Progress report estimated corn condition at 74% good-to-excellent and 5% poor-to-very poor; corn silking at 81% compared to 64% last week, 86% last year, and a 5-year average of 90%; and corn dough at 35% compared to 19% last week, 42% last year, and a 5-year average of 42%. In Tennessee, new crop cash corn contracts ranged from $3.12 to $3.46. December 2020 corn futures closed at $3.35, down 4 cents since last Friday. Downside price protection could be obtained by purchasing a $3.40 December 2020 Put Option costing 16 cents establishing a $3.24 futures floor. March 2021 corn futures closed at $3.46, down 3 cents since last Friday.
Soybeans
Net sales reported by exporters were up compared to last week with net sales of 13.4 million bushels for the 2019/20 marketing year and 84.5 million bushels for the 2020/21 marketing year. Exports for the same period were down 19% compared to last week at 17.2 million bushels. Soybean export sales and commitments were 104% of the USDA estimated total annual exports for the 2019/20 marketing year (September 1 to August 31), compared to the previous 5-year average of 103%. Average soybean basis weakened at Memphis, Upper-middle, and Northwest Tennessee and strengthened at Northwest Barge Points. Basis ranged from 15 under to 33 over the August futures contract at elevators and barge points. Average basis at the end of the week was 17 over the August futures contract. August 2020 soybean futures closed at $9.04, up 6 cents since last Friday. For the week, August 2020 soybean futures traded between $8.92 and $9.10. Aug/Sep and Aug/Nov future spreads were -6 and -5 cents. September 2020 soybean futures closed at $8.98, up 6 cents since last Friday. August/September soybean-to-corn price ratio was 2.77 at the end of the week.
Soybeans | Aug 20 | Change | Nov 20 | Change |
Price | $9.04 | $0.06 | $8.99 | $0.04 |
Support | $8.94 | $0.04 | $8.90 | $0.02 |
Resistance | $9.13 | $0.11 | $9.05 | $0.06 |
20 Day MA | $8.89 | $0.07 | $8.90 | $0.06 |
50 Day MA | $8.71 | $0.06 | $8.75 | $0.05 |
100 Day MA | $8.66 | $0.00 | $8.68 | -$0.01 |
4-Week High | $9.10 | $0.06 | $9.12 | $0.00 |
4-Week Low | $8.56 | $0.00 | $8.56 | $0.00 |
Technical Trend | Up | = | Down | - |
Nationally the Crop Progress report estimated soybean condition at 69% good-to-excellent and 7% poor-to-very poor; soybeans blooming at 64% compared to 48% last week, 35% last year, and a 5-year average of 57%; and soybeans setting pods at 25% compared to 11% last week, 6% last year, and a 5-year average of 21%. In Tennessee, soybean condition was estimated at 74% good-to-excellent and 6% poor-to-very poor; soybeans blooming at 47% compared to 34% last week, 51% last year, and a 5-year average of 57%; and soybeans setting pods at 21% compared to 10% last week, 23% last year, and a 5-year average of 27%. In Tennessee, new crop soybean cash contracts ranged from $8.77 to $9.25. Nov/Dec 2020 soybean-to-corn price ratio was 2.68 at the end of the week. November 2020 soybean futures closed at $8.99, up 4 cents since last Friday. Downside price protection could be achieved by purchasing a $9.00 November 2020 Put Option which would cost 24 cents and set an $8.76 futures floor.
Cotton
Net sales reported by exporters were down compared to last week with net sales cancellations of 13,100 bales for the 2019/20 marketing year and net sales of 10,900 bales for the 2020/21 marketing year. Exports for the same time period were down 13% compared to last week at 271,300 bales. Upland cotton export sales were 119% of the USDA estimated total annual exports for the 2019/20 marketing year (August 1 to July 31), compared to the previous 5-year average of 109%. Delta upland cotton spot price quotes for July 23 were 58.68 cents/lb (41-4-34) and 60.93 cents/lb (31-3-35). Adjusted World Price (AWP) decreased 1.22 cents to 49.04 cents.
Cotton | Dec 20 | Change | Mar 21 | Change |
Price | 60.10 | -1.84 | 60.82 | -1.81 |
Support | 59.63 | -1.85 | 60.29 | -1.90 |
Resistance | 63.23 | 0.49 | 63.94 | 0.57 |
20 Day MA | 62.37 | 0.63 | 63.04 | 0.63 |
50 Day MA | 60.39 | 0.46 | 61.07 | 0.45 |
100 Day MA | 58.65 | -0.09 | 59.49 | -0.10 |
4-Week High | 64.90 | 0.00 | 65.39 | 0.00 |
4-Week Low | 58.80 | 0.25 | 59.41 | 0.06 |
Technical Trend | Down | - | Down | - |
Nationally, the Crop Progress report estimated cotton condition at 47% good-to-excellent and 22% poor-to-very poor; cotton squaring at 73% compared to 63% last week, 73% last year, and a 5-year average of 75%; and cotton setting bolls at 27% compared to 18% last week, 29% last year, and a 5-year average of 32%. In Tennessee, cotton condition was estimated at 61% good-to-excellent and 12% poor-to-very poor; cotton squaring at 80% compared to 69% last week, 74% last year, and a 5-year average of 83%; and cotton setting bolls at 37% compared to 20% last week, 21% last year, and a 5-year average of 33%. December 2020 cotton futures closed at 60.1, down 1.84 cents since last Friday. For the week, December 2020 cotton futures traded between 59.51 and 63.46 cents. Dec/Mar and Dec/Dec cotton futures spreads were 0.61 cent and 0.72 cent. Downside price protection could be obtained by purchasing a 61 cent December 2020 Put Option costing 3.2 cents establishing a 57.8 cent futures floor. March 2021 cotton futures closed at 60.82 cents, down 1.81 cents since last Friday. December 2021 cotton futures closed at 60.71 cents, down 1.73 cents since last Friday.
Wheat
Wheat net sales reported by exporters were down compared to last week with net sales of 22.7 million bushels for the 2020/21 marketing year. Exports for the same time period were down 18% from last week at 19.4 million bushels. Wheat export sales were 35% of the USDA estimated total annual exports for the 2020/21 marketing year (June 1 to May 31), compared to the previous 5-year average of 35%.
Wheat | Sep 20 | Change | Jul 21 | Change |
Price | $5.39 | $0.05 | $5.50 | $0.07 |
Support | $5.21 | -$0.04 | $5.32 | -$0.04 |
Resistance | $5.41 | -$0.03 | $5.54 | $0.02 |
20 Day MA | $5.16 | $0.10 | $5.30 | $0.07 |
50 Day MA | $5.10 | $0.01 | $5.29 | $0.01 |
100 Day MA | $5.23 | $0.00 | $5.35 | $0.00 |
4-Week High | $5.51 | $0.00 | $5.54 | $0.00 |
4-Week Low | $4.71 | $0.00 | $4.96 | $0.00 |
Technical Trend | Up | = | Up | = |
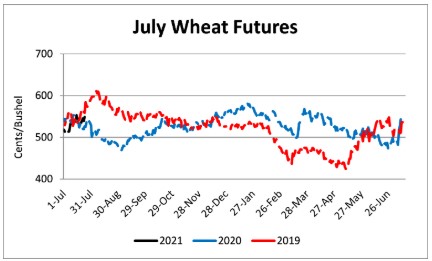
Nationally the Crop Progress report estimated winter wheat harvested at 74% compared to 68% last week, 66% last year, and a 5-year average of 75%; spring wheat condition at 68% good-to-excellent and 7% poor-to-very poor; and spring wheat headed at 91% compared to 80% last week, 88% last year, and a 5-year average of 94%. In Tennessee, July 2020 cash contracts ranged from $5.05 to $5.61. September 2020 wheat futures closed at $5.39, up 5 cents since last Friday. September 2020 wheat futures traded between $5.17 and $5.44 this week. September wheat-to-corn price ratio was 1.65. Sep/Dec and Sep/Jul future spreads were 6 and 11 cents. December 2020 wheat futures closed at $5.45 up 5 cents since last Friday. December wheat-to-corn price ratio was 1.63. July 2021 wheat futures closed at $5.50, up 7 cents since last Friday. Downside price protection could be obtained by purchasing a $5.50 July 2021 Put Option costing 37 cents establishing a $5.13 futures floor.
Source : tennessee.edu