Overview
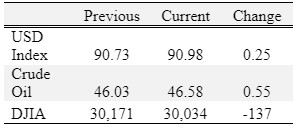
Corn, cotton, and wheat were up; soybeans were mixed for the week.
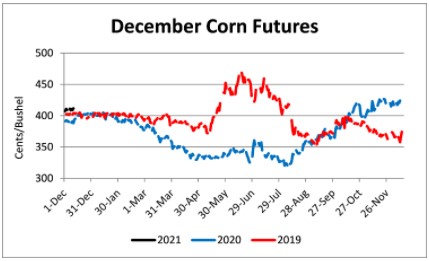
Since November 10, March corn futures have moved mostly sideways in a trading range of $4.13 to $4.40. While a breakout higher cannot be ruled out, it appears corn prices may consolidate in a new trading range and move sideways through the end of the year. This is after the impressive rally from August to November that saw March corn increase over $1.00 ($3.38 to $4.40). Continued strong export sales have the potential to provide support to prices. On the bearish side rising ethanol stocks and new COVID-19 restrictions, reducing travel, could limit corn purchased for ethanol production in early 2021.
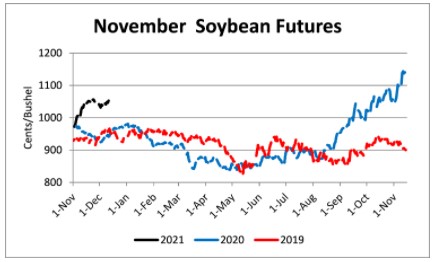
January soybeans have also started to move sideways in a tighter trading range, between $11.40 and $12.00. New export sales have slowed substantially over the past three weeks, however export shipments of past sales remain extremely strong with almost 100 million bushels shipped for the week of November 27-December 3. Rains in Brazil have mitigated some of the concerns in South America, however moisture remains below normal and could affect production if dry weather reemerges. With U.S soybean ending stocks projected at only 175 million bushels a decline in South American production could trigger higher prices and increased volatility.
Last week’s price declines in wheat were reversed by a moderately bullish WASDE report. Global wheat stocks were decreased 145 million bushels, due primarily to lower EU production and increased feed use as feed wheat is more price competitive with corn in global markets. Although projected wheat stocks are down compared to last month, the USDA projections still indicate record large global ending stocks at 11.63 billion bushels, up 584 million year-over-year.
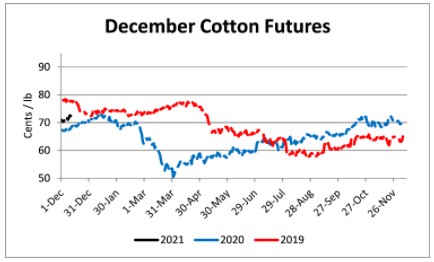
Cotton received bullish support from the December WASDE report with U.S. production being revised down 1.14 million bales. Reductions were expected but the combination of lower production and increased exports (+400,000 bales) leaves projected stocks at a more manageable 5.7 million bales. Foreign cotton stocks were also revised down 2.42 million bales from the previous month’s projection of 94.24 million bales. With the changes made by USDA to supply and demand estimates cotton prices have the potential to work higher possibly to the 75-78 cent range. Unfortunately, COIVD-19 triggered disruptions to the U.S. and global economies could quickly remove this optimism.
Corn
Ethanol production for the week ending December 4 was 0.991 million barrels per day, up 17,000 barrels from the previous week. Ethanol stocks were 22.083 million barrels, up 0.843 million barrels compared to last week. Corn net sales reported by exporters for November 27-Decmber 3 were down compared to last week with net sales of 53.6 million bushels for the 2020/21 marketing year. Exports for the same time period were down 33% from last week at 28.1 million bushels. Corn export sales and commitments were 59% of the USDA estimated total exports for the 2020/21 marketing year (September 1 to August 31) compared to the previous 5-year average of 46%. Across Tennessee, average corn basis (cash price-nearby futures price) weakened at North-Central, Mississippi River, West-Central, Northwest, and West elevators and barge points. Overall, basis for the week ranged from 10 under to 28 over, with an average of 15 over the March futures. March 2021 corn futures closed at $4.23, up 3 cents since last Friday. For the week, March 2021 corn futures traded between $4.15 and $4.27. Mar/May and Mar/Dec future spreads were 3 and -11 cents. May 2021 corn futures closed at $4.26, up 3 cents since last Friday.
Corn | Mar 21 | Change | Dec 21 | Change |
Price | $4.23 | $0.03 | $4.12 | $0.02 |
Support | $4.15 | $0.01 | $4.05 | $0.00 |
Resistance | $4.28 | -$0.01 | $4.15 | $0.01 |
20 Day MA | $4.25 | $0.00 | $4.09 | $0.02 |
50 Day MA | $4.15 | $0.05 | $4.00 | $0.02 |
100 Day MA | $3.87 | $0.03 | $3.88 | $0.02 |
4-Week High | $4.39 | $0.00 | $4.15 | $0.00 |
4-Week Low | $4.13 | $0.05 | $4.00 | $0.08 |
Technical Trend | Down | - | Down | - |
December 2021 corn futures closed at $4.12, up 2 cents since last Friday. Downside price protection could be obtained by purchasing a $4.20 December 2021 Put Option costing 38 cents establishing a $3.82 futures floor.
Soybeans
Net sales reported by exporters were up compared to last week with net sales of 20.9 million bushels for the 2020/21 marketing year and 6.2 million bushels for the 2021/22 marketing year. Exports for the same period were up 8% compared to last week at 98.9 million bushels. Soybean export sales and commitments were 88% of the USDA estimated total annual exports for the 2020/21 marketing year (September 1 to August 31), compared to the previous 5-year average of 64%. Across Tennessee, average soybean basis weakened or remained unchanged at Mississippi River, West, West-Central, North-Central, and Northwest elevators and barge points. Basis ranged from 9 under to 27 over the January futures contract. Average basis at the end of the week was 11 over the January futures contract. January 2021 soybean futures closed at $11.60, down 3 cents since last Friday. For the week, January 2021 soybean futures traded between $11.42 and $11.78. Jan/Mar and Jan/Nov future spreads were 6 and -108 cents. March 2021 soybean futures closed at $11.66, up 1 cent since last Friday. March 2021 soybean-to-corn price ratio was 2.76 at the end of the week.
Soybeans | Jan 21 | Change | Nov 21 | Change |
Price | $11.60 | -$0.03 | $10.52 | $0.14 |
Support | $11.46 | -$0.03 | $10.38 | $0.08 |
Resistance | $11.69 | -$0.10 | $10.60 | $0.14 |
20 Day MA | $11.67 | $0.06 | $10.46 | $0.07 |
50 Day MA | $11.09 | $0.14 | $10.08 | $0.09 |
100 Day MA | $10.29 | $0.13 | $9.68 | $0.08 |
4-Week High | $12.00 | $0.00 | $10.60 | $0.00 |
4-Week Low | $11.38 | $0.55 | $10.22 | $0.35 |
Technical Trend | Down | - | Down | - |
November 2021 soybean futures closed at $10.52, up 14 cents since last Friday. Downside price protection could be achieved by purchasing a $10.60 November 2021 Put Option which would cost 76 cents and set a $9.84 futures floor. Nov/Dec 2021 soybean-to-corn price ratio was 2.55 at the end of the week.
Cotton
Net sales reported by exporters were up compared to last week with net sales of 451,000 bales for the 2020/21 marketing year and 48,000 for the 2021/22 marketing year. Exports for the same time period were up 79% compared to last week at 323,200 bales. Upland cotton export sales were 76% of the USDA estimated total annual exports for the 2020/21 marketing year (August 1 to July 31), compared to the previous 5-year average of 66%. Delta upland cotton spot price quotes for December 10 were 71.51 cents/lb (41-4-34) and 73.76 cents/lb (31-3-35). Adjusted World Price (AWP) decreased 0.25 cents to 58.17 cents. March 2021 cotton futures closed at 74.08, up 2.51 cents since last Friday. For the week, March 2021 cotton futures traded between 71.35 and 74.75 cents. Mar/May and Mar/Dec cotton futures spreads were 0.81 cents and -1.71 cents. May 2021 cotton futures closed at 74.89 cents, up 2.44 cents since last Friday.
Cotton | Mar 21 | Change | Dec 21 | Change |
Price | 74.08 | 2.51 | 72.37 | 1.67 |
Support | 71.99 | 1.51 | 71.20 | 1.32 |
Resistance | 75.73 | 3.43 | 73.28 | 2.26 |
20 Day MA | 72.32 | 0.51 | 70.84 | 0.56 |
50 Day MA | 71.14 | 0.66 | 69.77 | 0.60 |
100 Day MA | 68.15 | 0.50 | 67.17 | 0.45 |
4-Week High | 74.75 | 0.48 | 72.85 | 1.04 |
4-Week Low | 70.18 | 0.11 | 68.69 | 0.09 |
Technical Trend | Up | = | Up | = |
December 2021 cotton futures closed at 72.37 cents, up 1.67 cents since last Friday. Downside price protection could be obtained by purchasing a 73 cent December 2021 Put Option costing 5.42 cents establishing a 67.58 cent futures floor.
Wheat
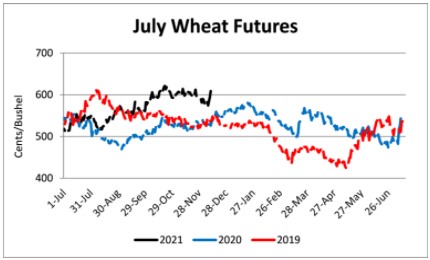
Wheat net sales reported by exporters were up compared to last week with net sales of 22.7 million bushels for the 2020/21 marketing year. Exports for the same time period were up 22% from last week at 20.3 million bushels. Wheat export sales were 73% of the USDA estimated total annual exports for the 2020/21 marketing year (June 1 to May 31), compared to the previous 5-year average of 72%. March 2021 wheat futures closed at $6.14, up 39 cents since last Friday. March 2021 wheat futures traded between $5.65 and $6.19 this week. March wheat-to-corn price ratio was 1.45. Mar/May and Mar/Jul future spreads were 0 and -7 cents. May 2021 wheat futures closed at $6.14, up 36 cents since last Friday.
Wheat | Mar 21 | Change | Jul 21 | Change |
Price | $6.14 | $0.39 | $6.07 | $0.28 |
Support | $5.79 | $0.11 | $5.80 | $0.08 |
Resistance | $6.37 | $0.48 | $6.25 | $0.34 |
20 Day MA | $5.94 | -$0.05 | $5.95 | -$0.04 |
50 Day MA | $6.03 | $0.02 | $5.99 | $0.02 |
100 Day MA | $5.74 | $0.02 | $5.74 | $0.02 |
4-Week High | $6.22 | -$0.06 | $6.15 | -$0.04 |
4-Week Low | $5.65 | -$0.09 | $5.70 | -$0.08 |
Technical Trend | Up | + | Up | + |
In Tennessee, new crop wheat cash contracts ranged from $5.61 to $6.10. July 2021 wheat futures closed at $6.07, up 28 cents since last Friday. Downside price protection could be obtained by purchasing a $6.10 July 2021 Put Option costing 42 cents establishing a $5.68 futures floor.
Source : tennessee.edu