Overview
Corn, cotton, soybeans and wheat were up for the week.
The end of the year is a good time to reflect on what occurred in corn, cotton, soybean, and wheat markets in 2020 and look towards 2021. To say that 2020 was a challenging year is an understatement. In January 2020, many were cautiously optimistic –harvest futures for corn were over $4.00, soybeans were $9.70, cotton was 72 cents, and wheat was $5.80. The Phase One trade deal with China was newly signed and many were projecting net farm income improvements compared to the two most recent years. Then the COVID-19 pandemic occurred and pulled the rug out from under commodity markets. Prices tanked – harvest futures for corn bottomed at $3.20, soybeans at $8.39, cotton at 50.41 cents, and wheat at $4.69. Throughout most of the 2020 growing season producers had limited chances to price production at a profitable level. However, in August, price direction changed and a bullish trend that will be carried into the New Year was started – as at the end of December nearby futures for corn were $4.84, soybeans $13.11, cotton 78.12 cents, and wheat $6.40. The rapid improvement in prices had little to do with COVID-19. The rally was primarily driven by increased export demand and domestic and foreign weather reducing production. From a marketing standpoint, 2020 is closing on a high, with renewed optimism for row crop producers in 2021.
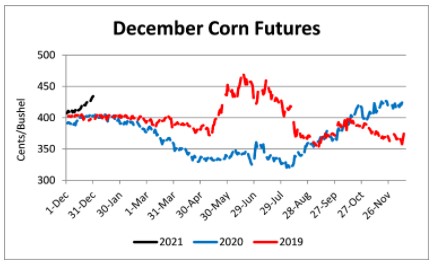
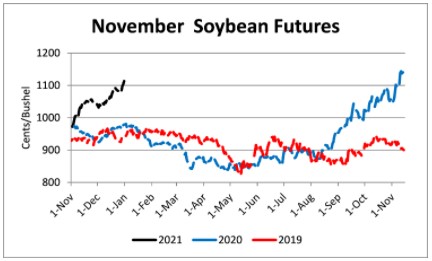
So what should be expect in 2021? Tight supplies of corn and soybeans will help hold and perhaps fuel higher prices early in 2021. Global demand for grains and oilseeds is strong and export sales continue to exceed expectations. To maintain the current bullish trend demand will need to remain strong. Wheat and cotton prices have been pulled higher, however global supplies are not as bullish as corn and soybeans, so expectations may need to be tapered for those markets. Currently, 2021 planting favors increased corn and soybean acres at the expense of cotton in the Mid-South. Those without investments in cotton infrastructure and supply chains will likely reduce cotton acres in favor of corn and soybean plantings. 2021 harvest futures for corn -- $4.34 and soybeans – $11.11, warrant consideration for pricing a portion (10-30%) of projected 2021 production. As the season progresses, using incremental sales as prices increase 10 cents for corn and 25 cents for soybeans is a prudent strategy and will allow producers to increase the amount of production priced if the market continues to rally. Each producer has a preference as to how much of their anticipated production they like to have priced at different times of the year, however it is important to not over price anticipated production. 2021 is looking very promising for crop producers but action needs to be taken if producers want to offset some of their price risk.
Corn
Ethanol production for the week ending December 25 was 0.934 million barrels per day, down 42,000 barrels from the previous week. Ethanol stocks were 23.504 million barrels, up 0.335 million barrels compared to last week. Corn net sales reported by exporters for December 18-24 were up compared to last week with net sales of 37.9 million bushels for the 2020/21 marketing year. Exports for the same time period were up 60% from last week at 52.7 million bushels -- a marketing year high. Corn export sales and commitments were 64% of the USDA estimated total exports for the 2020/21 marketing year (September 1 to August 31) compared to the previous 5-year average of 52%. Across Tennessee, average corn basis (cash price-nearby futures price) strengthened or remained unchanged at Northwest, North-Central, Mississippi River, West-Central, and West elevators and barge points. Overall, basis for the week ranged from 5 over to 40 over, with an average of 23 over the March futures. March 2021 corn futures closed at $4.84, up 33 cents since last Friday. For the week, March 2021 corn futures traded between $4.48 and $4.85. Mar/May and Mar/Dec future spreads were -1 and -50 cents. May 2021 corn futures closed at $4.83, up 32 cents since last Friday.
Corn | Mar 21 | Change | Dec 21 | Change |
Price | $4.84 | $0.33 | $4.34 | $0.10 |
Support | $4.56 | $0.35 | $4.26 | $0.17 |
Resistance | $4.90 | $0.52 | $4.37 | $0.20 |
20 Day MA | $4.38 | $0.12 | $4.17 | $0.06 |
50 Day MA | $4.27 | $0.09 | $4.07 | $0.05 |
100 Day MA | $4.01 | $0.09 | $3.96 | $0.05 |
4-Week High | $4.85 | $0.46 | $4.36 | $0.17 |
4-Week Low | $4.14 | $0.00 | $4.04 | $0.00 |
Technical Trend | Up | = | Up | = |
December 2021 corn futures closed at $4.34, up 10 cents since last Friday. Downside price protection could be obtained by purchasing a $4.40 December 2021 Put Option costing 41 cents establishing a $3.99 futures floor.
Soybeans
Net sales reported by exporters were up compared to last week with net sales of 25.6 million bushels for the 2020/21 marketing year and 11.6 million bushels for the 2021/22 marketing year. Exports for the same period were down 3% compared to last week at 89.6 million bushels. Soybean export sales and commitments were 92% of the USDA estimated total annual exports for the 2020/21 marketing year (September 1 to August 31), compared to the previous 5-year average of 72%. Across Tennessee, average soybean basis strengthened at West-Central, Mississippi River, West, North-Central, and Northwest elevators and barge points. Basis ranged from 3 under to 39 over the March futures contract. Average basis at the end of the week was 23 over the March futures contract. March 2021 soybean futures closed at $13.11, up 47 cents since last Friday. For the week, March 2021 soybean futures traded between $12.46 and $13.20. Mar/May and Mar/Nov future spreads were -5 and -200 cents. May 2021 soybean futures closed at $13.06, up 44 cents since last Friday. March 2021 soybean-to-corn price ratio was 2.71 at the end of the week.
Soybeans | Mar 21 | Change | Nov 21 | Change |
Price | $13.11 | $0.47 | $11.11 | $0.28 |
Support | $12.69 | $0.98 | $10.85 | $0.32 |
Resistance | $13.21 | $1.04 | $11.15 | $0.32 |
20 Day MA | $12.15 | $0.41 | $10.70 | $0.19 |
50 Day MA | $11.58 | $0.33 | $10.37 | $0.19 |
100 Day MA | $10.71 | $0.27 | $9.93 | $0.16 |
4-Week High | $13.20 | $0.97 | $11.18 | $0.34 |
4-Week Low | $11.43 | $0.01 | $10.22 | $0.00 |
Technical Trend | Up | = | Up | = |
November 2021 soybean futures closed at $11.11, up 28 cents since last Friday. Downside price protection could be achieved by purchasing an $11.20 November 2021 Put Option which would cost 79 cents and set a $10.41 futures floor. Nov/Dec 2021 soybean-to-corn price ratio was 2.56 at the end of the week.
Cotton
Net sales reported by exporters were down compared to last week with net sales of 287,900 bales for the 2020/21 marketing year and 15,100 for the 2021/22 marketing year. Exports for the same time period were down 1% compared to last week at 275,100 bales. Upland cotton export sales were 78% of the USDA estimated total annual exports for the 2020/21 marketing year (August 1 to July 31), compared to the previous 5-year average of 71%. Delta upland cotton spot price quotes for December 30 were 74.97 cents/lb (41-4-34) and 77.22 cents/lb (31-3-35). Adjusted World Price (AWP) increased 1.11 cents to 62.01 cents. March 2021 cotton futures closed at 78.12, up 1.92 cents since last Friday. For the week, March 2021 cotton futures traded between 76.15 and 78.12 cents. Mar/May and Mar/Dec cotton futures spreads were 0.58 cents and -3.25 cents. May 2021 cotton futures closed at 78.7 cents, up 1.84 cents since last Friday.
Cotton | Mar 21 | Change | Dec 21 | Change |
Price | 78.12 | 1.92 | 74.87 | 1.17 |
Support | 77.09 | 2.29 | 74.43 | 2.01 |
Resistance | 78.91 | 0.31 | 75.47 | 0.77 |
20 Day MA | 75.00 | 1.51 | 72.83 | 1.10 |
50 Day MA | 73.00 | 1.01 | 71.17 | 0.73 |
100 Day MA | 69.83 | 0.98 | 68.59 | 0.83 |
4-Week High | 78.39 | 0.98 | 75.25 | 1.15 |
4-Week Low | 71.07 | 0.00 | 70.19 | 0.09 |
Technical Trend | Up | = | Up | = |
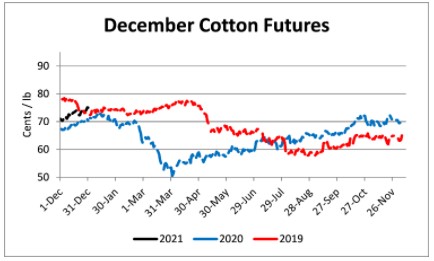
December 2021 cotton futures closed at 74.87 cents, up 1.17 cents since last Friday. Downside price protection could be obtained by purchasing a 75 cent December 2021 Put Option costing 5.34 cents establishing a 69.66 cent futures floor.
Wheat
Wheat net sales reported by exporters were up compared to last week with net sales of 19.1 million bushels for the 2020/21 marketing year. Exports for the same time period were up 19% from last week at 16.0 million bushels. Wheat export sales were 77% of the USDA estimated total annual exports for the 2020/21 marketing year (June 1 to May 31), compared to the previous 5-year average of 79%. March 2021 wheat futures closed at $6.40, up 13 cents since last Friday. March 2021 wheat futures traded between $6.07 and $6.44 this week. March wheat-to-corn price ratio was 1.32. Mar/May and Mar/Jul future spreads were -1 and -12 cents. May 2021 wheat futures closed at $6.39, up 14 cents since last Friday.
Wheat | Mar 21 | Change | Jul 21 | Change |
Price | $6.40 | $0.13 | $6.28 | $0.13 |
Support | $6.03 | $0.05 | $6.00 | $0.05 |
Resistance | $6.62 | $0.43 | $6.42 | $0.31 |
20 Day MA | $6.05 | $0.11 | $6.01 | $0.07 |
50 Day MA | $6.06 | $0.02 | $6.02 | $0.02 |
100 Day MA | $5.85 | $0.08 | $5.84 | $0.07 |
4-Week High | $6.44 | $0.22 | $6.29 | $0.14 |
4-Week Low | $5.65 | $0.00 | $5.70 | $0.00 |
Technical Trend | Up | = | Up | = |
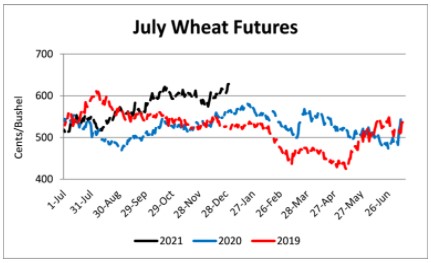
In Tennessee, new crop wheat cash contracts ranged from $5.94 to $6.41. July 2021 wheat futures closed at $6.28, up 13 cents since last Friday. Downside price protection could be obtained by purchasing a $6.30 July 2021 Put Option costing 48 cents establishing a $5.82 futures floor.
Source : tennessee.edu