What impact will DON and the Canadian dollar play in Ontario?
Ontario farmers plan to plant record acres of corn this spring. The weak Canadian dollar is part of the reason the farmers are planting more corn. DON fears do not seem to be having a significant impact.
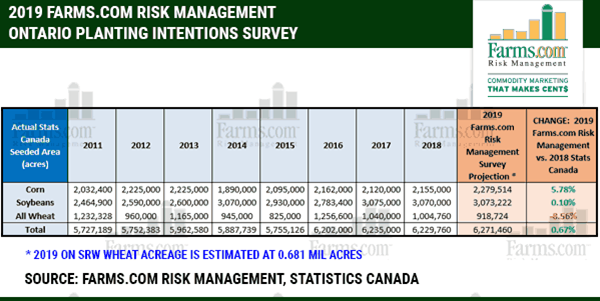
Farms.com Risk Management conducted a 2019 Ontario Planting Intentions farmer survey from January 23rd – March 24th, 2019. The survey forecasts that Ontario farmers intend to plant a record amount of corn, unchanged soybean acres, and lower wheat acres compared to 2018.
“This is inline to planting intentions recently announced by the US Department of Agriculture (USDA),” said Moe Agostino, chief commodity strategist with Farms.com Risk Management.
According to Agostino, on March 29th, 2019, the USDA surprised everyone in its 2019 Prospective Plantings release by reporting higher than expected U.S. corn acres, but lower than expected soybean acres. Total U.S. principal crop acreage fell by 4.226 million year-over-year (Y/Y), to just under 315.35 million acres. 2019 U.S. corn acreage came in at 92.8 million acres (trade expected range was 89.50 – 92.70), which is up 3.66 million acres Y/Y, and soybeans came in at 84.60 million acres (trade expected range was 84.26 – 88.00), which is down 4.6 million acres Y/Y. The drop in soybean acreage reflects a normal crop rotation back to corn and farmers’ intentions being less sensitive to the continued Chinese trade tariff retaliation/backlash.
The day after the USDA report, on Friday, April 5, commodity futures plunged as an over-reaction to the USDA survey. Industry experts felt that the USDA was too high on corn acreage assumptions, and too low on soybeans, considering the amount of flooding that occurred in March in the U.S. Western Corn Belt.
According to Farms.com Risk Management, Ontario farmers are expected to plant 5.78% more corn acres Y/Y, or up +124,514 acres, to a new record high of 2,279,514 acres in 2019. The largest increases are from Western, Central and Southern Ontario. 2019 soybean acres will remain above 3 million acres, up +0.10% Y/Y or up +3,222 acres, with a decline in Western Ontario offset by an increase in Southern Ontario. IP soybean acres will be up 13.21%. Total all wheat acres will be down 8.56% to 918,724 acres and below the 5-year average. The largest drop in wheat acreage is from Southern Ontario. Total SRW wheat acres come in at 681,000 acres.

“Record 2018 yields are outweighing any disease issues with VOM (DON) from 2018,” said Agostino.
“A lower Canadian dollar (CDN $) continues to provide a bonus to Ontario farmers for the 4th consecutive year and remains basis-friendly. A weak Canadian economy is weighing on the Canadian dollar while stronger than expected crude oil prices are offsetting,” said Agostino.
Many in the industry are not surprised by what farmers in Ontario have indicated in the survey. “I am not surprised by the results,” says Steve Denys, Director of Business Management for Maizex Seeds. “Heavy clay areas like Essex and Lambton would switch to soybean acres, but everyone else would plant more corn acres. Ontario farmers are making seed variety decisions in 2019, adjusting planting dates, population sizes and when to fungicide to minimize the impact of DON in their corn fields in 2019.”
Farms.com Risk Management conducted the planting intentions survey during the months of January, February, and March 2019. It is a probability survey that includes a sample of farmers from across Ontario.
For more information about the Farms.com Risk Management Planting Intentions Report: https://riskmanagement.farms.com/research/ontario-planting-intentions
Legal note: The Farms.com Risk Management survey used to make the acreage estimates is subject to sampling and non-sampling errors that are common to all surveys. Sampling errors represent the variability between estimates that would result if many different samples were surveyed at the same time. Sampling errors for major crops are generally between 1.0 – 3.0% but they cannot be applied directly to the acreage published in this report to determine confidence intervals because the official estimates represent a composite of information from more than a single source.