By Carl Zulauf
Department of Agricultural, Environmental and Development Economics
Ohio State University
Nick Paulson and Gary Schnitkey
Department of Agricultural and Consumer Economics
University of Illinois
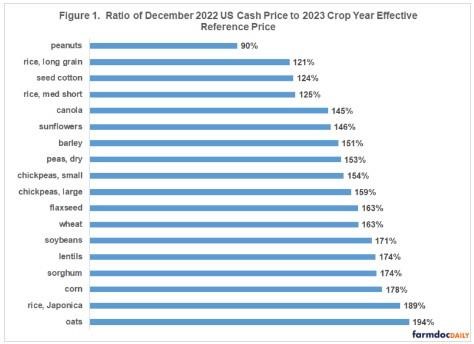
A price ratio is discussed that has been over 80% accurate in predicting if ARC-CO (Agriculture Risk Coverage – county version) or PLC (Price Loss Coverage) will have the higher US average payment per base acre (December 9, 2021 farmdoc daily). For the 2023 ARC-CO vs. PLC decision, the ratio is: (US December 2022 cash price divided by 2023 crop year effective reference price) (hereafter, Dec. cash – ERP ratio). Except for peanuts, the indicator suggests ARC-CO will have the higher US average payment per base acre. ARC-CO payments are not likely to be large and will likely occur only if county yield is well below trend. They may help manage financial risk in this situation. The January 24, 2023 farmdoc daily also discusses the 2023 program decision.
2023 Decision
Commodity program options for the 2023 crop year are ARC-CO, PLC, and ARC-IC, a farm version of ARC. They are briefly discussed in Data Note 1. The most common decision is ARC-CO vs. PLC. ARC-IC was elected for only 1.2% of US base acres enrolled in the 2022 program. The ARC-CO vs. PLC decision indicator is:
- PLC is expected to pay more per US base acre if Dec. cash – ERP ratio is less than 100%.
- ARC-CO is expected to pay more per US base acre if the price ratio equals or exceeds 100%.
PLC is a national payment program that makes payments only if the US market year price is less than the effective reference price. December cash price are used as an indicator of next market year’s US average price. December prices are in the Agricultural Prices report released at the end of January and thus available before the March 15, 2023 decision deadline (see Data Note 2). The effective reference prices for 2023 are from the Farm Service Agency. Using this data, a Dec. 2022 cash – 2023 ERP price ratio can be calculated for 18 program commodities (see Figure 1 and Data Note 3). It exceeds 100% for 17 of them. Peanuts is the exception. The ratio is relatively similar for corn (178%), soybeans (171%), and wheat (163%).

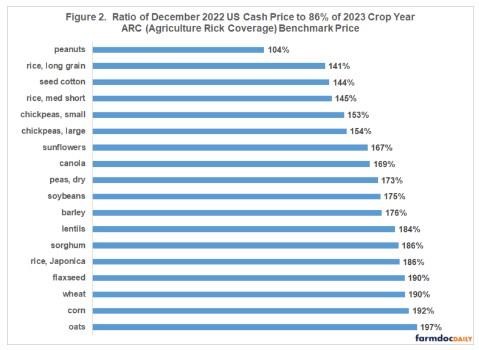
The ratios imply that, except for peanuts, ARC-CO is expected to have a higher average US payment per base acre than PLC. The reason is that, unlike PLC, ARC can make payments for low yields. For the 17 crops, ARC is not likely to make a payment due to a decline in price since the December 2022 cash price is well above the ARC program price (see Figure 2). ARC will thus likely make a payment only if 2023 county or farm yield is notably below trend yield (see Data Note 4).

Discussion
The 2023 ARC-CO vs. PLC decision indicator suggests that for most program commodities ARC-CO will have the higher US average payment per base acre, including corn, soybeans, and wheat.
PLC is expected to have a higher US average payment per base acre for peanuts. Otherwise, payments by PLC are currently unlikely as market prices are well above the effective reference prices.
ARC payment are expected to be small and occur only when yield is well below trend yield. ARC payments will thus likely be to some not all base acres in ARC.
From an income perspective, average payments by both ARC-CO and PLC are expected to be small to none for the 2023 market year, except possibly peanuts.
However, the 2023 commodity program decision may have importance from a risk management perspective. If a production disaster occurs in a county, an ARC-CO payment for low yield may provide some assistance for financial stress due to low yields. For the 2021 crop year, ARC-CO payments were largely zero but did occur in counties with yields well below trend (October 25, 2022 farmdoc daily).
When making the 2023 commodity program decision, farmers may want to consider that SCO (crop insurance Supplemental Coverage Option) is available only with PLC. It is NOT an option for acres in ARC-CO or ARC-IC. Considerations when buying SCO as well as ECO (Enhanced Coverage Option) are discussed in the February 15, 2022 farmdoc daily. ECO is available with both ARC and PLC.
Data Notes
- ARC-CO provides transition assistance when county revenue declines from multiple years of high revenue to a revenue that is less than 86% of benchmark market revenue for 5 recent crop years. PLC provides assistance for low prices, where low is less than 100% of the effective reference price (ERP) that Congress defined. ARC-IC provides assistance when average per acre revenue from all program crops planted on an ARC-IC farm unit is less than 86% of its per acre benchmark revenue. An ARC-IC farm unit is the sum of a producer’s share in all FSA farms he/she enrolled in ARC-IC in a state. ARC-CO benchmark revenue equals (5-year Olympic average (high and low values removed) of US market year cash price times trend-adjusted county yield). ERP is a floor on ARC price for a year. PLC payment yield is a farm’s average yield over a historical period. ARC-CO, PLC, and ARC-IC pay on 85%, 85%, and 65% of base acres, respectively. ARC payment is capped at 10% of benchmark revenue. PLC payment rate per unit is capped at (ERP minus loan rate). The October 29, 2019 farmdoc daily discusses when ARC-IC is an option to consider.
- Futures market prices are available for only a few program commodities. A US cash price for January is released at the end of February, but anecdotal evidence suggests most farm program decisions are made before then. December and January cash prices result in different indicator signals roughly 6% of the time. In these instances, ARC-CO and PLC payment per base acre differ, on average, by less than $10.
- A US December cash price is not reported for crambe, mustard, rapeseed, safflower, and sesame. The price used for temperate Japonica rice is the medium-short grain rice price for California. Almost all US Japonica rice is grown in California. The price used for medium-short grain rice is the average for states other than California.
- ARC benchmark price for the 2023 crop year is an Olympic average of 2017-2021 market year prices. This calculation window includes little of the higher price period that began in the summer of 2020. The Olympic average removes the higher 2021 prices.
Source : illinois.edu