By Nick Paulson and Gary Schnitkey et.al
The price discovery period for the Harvest Prices used to determine crop insurance indemnities for revenue products concluded at the end of October. The 2024 harvest price for corn is $4.16 per bushel, $0.50 or 11% lower than the projected price of $4.66. The 2024 harvest price for soybeans is $10.03 per bushel, $1.52 or 13% below the projected price of $11.55.
The harvest price declines for corn and soybeans in 2024 are not sufficient to trigger individual farm revenue coverage payments even at the highest coverage level of 85%. Area revenue plans – including the Area Risk Plans of Insurance (ARPI) and Supplemental and Enhanced Coverage Options (SCO and ECO) – offer higher county-based coverage levels that could trigger payments even in counties with yields above expected county yields.
Corn
Settlement prices for the December 2024 corn contract averaged $4.16 per bushel during October. The $4.16 harvest price is $0.50, or 11%, below corn’s projected price of $4.66 per bushel. Because the harvest price is lower than the projected price, both major individual revenue insurance programs, Revenue Protection (RP) and Revenue Protection with the Harvest Price Exclusion (RP-HPE) will use the same revenue guarantee and result in the same indemnity payment if they are triggered.
The 11% price decline for corn is not sufficient to trigger RP or RP-HPE indemnities without yield losses relative to the farm’s guarantee yield, even at the highest coverage level available of 85%. The guarantee yield in most cases will be the farm’s Trend-adjusted Actual Production History yield. For simplicity we refer to this as the farm’s APH yield.
An 85% coverage level policy would require yields be at least 5% below the farm’s APH yield to trigger payments. An 80% coverage level would require yields be at least 10% below the farm’s APH to trigger payments. Indemnity payments on 75% or 70% coverage policies would require yield losses of at least 16% or 22%, respectively.
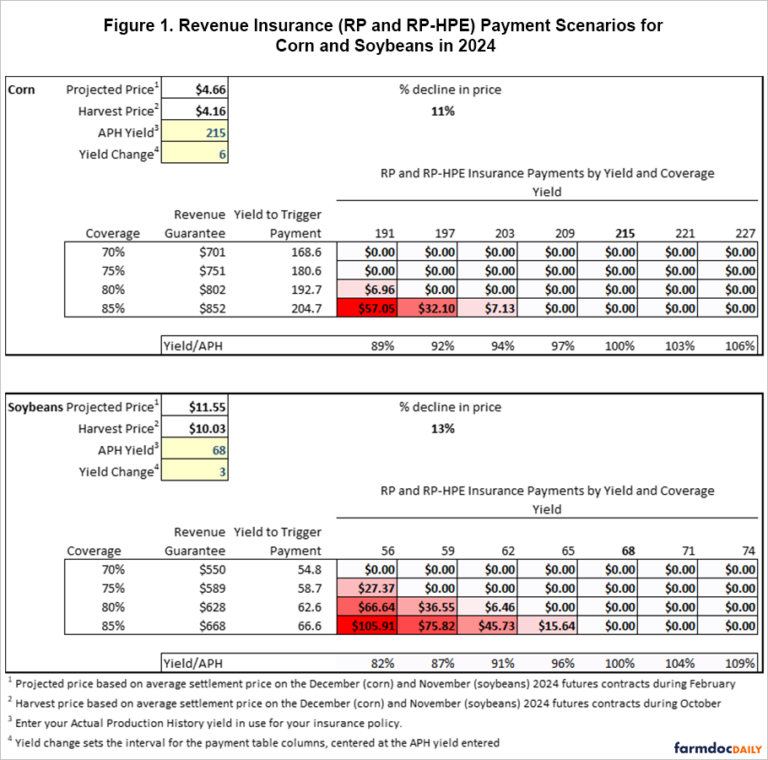
Payment scenarios for a farm with a 215 bushel per acre APH yield for corn are provided below in the upper panel of Figure 1. At 85% coverage, the farm’s yield would need to be less than 204.7 bushels per acre. At a 203 bushel per acre yield, 85% revenue coverage would trigger a $7.13 per acre payment. A 191 bushel per acre yield would trigger a $57.05 per acre indemnity for 85% coverage.
Lower coverage levels would require yields to be further below the farm’s APH to trigger revenue insurance payments. For the example farm, yield would need to be below 192.7 bushels per acre to trigger payments with an 80% coverage level. Yields at or below 168.6 bushels per acre would be required to trigger payments on a policy with a 70% coverage level.
Figure 1 is a screenshot from a simple Excel-based revenue insurance payment calculator for corn and soybeans. The calculator is available for download HERE. Users can enter their own insurance yields to calculate potential insurance payments from RP or RP-HPE.

Soybeans
Settlement prices for the November 2024 soybean futures contract averaged $10.03 in October. This is a decline of $1.52, or 13%, below soybean’s projected price of $11.55. As with corn, the price decline is not sufficient to trigger payments from the individual revenue policies (RP or RP-HPE) without some level of yield loss relative to a farm’s APH yield.
The 13% price decline for soybeans implies that a yield loss exceeding 2% would be needed to trigger payments on 85% coverage level policies. Required yield losses exceed 8% for 80% coverage, 14% for 75% coverage, and 19% for 70% coverage.
Individual revenue insurance payment scenarios for a farm with a 68 bushel per acre APH yield are provided in the lower panel of Figure 1. At 85% coverage, individual revenue policy payments would be triggered at yields below 66.6 bushels per acre. A yield of 65 bushels per acre would result in a $15.64 per acre indemnity at 85% coverage, while a yield of 59 bushels per acre would trigger a $75.82 per acre indemnity payment. Trigger yields at lower coverage levels would be 62.6 (80% coverage), 58.7 (75% coverage), and 54.8 (70% coverage) bushels per acre.
Area Insurance Plans
Area and supplemental area insurance plans offer higher coverage levels compared with the underlying individual plans of insurance.
The Supplemental Coverage Option (SCO) has a coverage level of 86%, with a coverage band extending down to the farmer’s individual plan coverage level. Based on corn’s harvest price of $4.16, SCO payments would be triggered in counties where actual county yields are at least 4% below expected county yields. The soybean harvest price of $10.03 means that counties with average soybean yields at least 1% below the expected county yield would trigger SCO payments.
Ninety percent area revenue coverage is available through the Area Risk Plan of Insurance (ARPI) and the Enhanced Coverage Option (ECO) supplemental plan. ECO covers county losses between the elected coverage level and the 86% coverage level of SCO.
For corn, county yields that are less than 101% of the expected county yield would trigger 90% ARPI or ECO payments. For soybeans, county yields less than 104% of the expected county yield would trigger ARPI or ECO payments with 90% coverage.
ECO also offers a 95% coverage level option. County corn yields that are below 106% of the expected county yield would trigger 95% ECO payments. County soybean yields that are below 109% of the expected county guarantee would trigger 95% ECO payments.
Note that the county yields used by the Risk Management Agency to determine ARPI, SCO, and ECO payments for 2024 will not be released until June of 2025.
2024 State-level Yield Forecasts
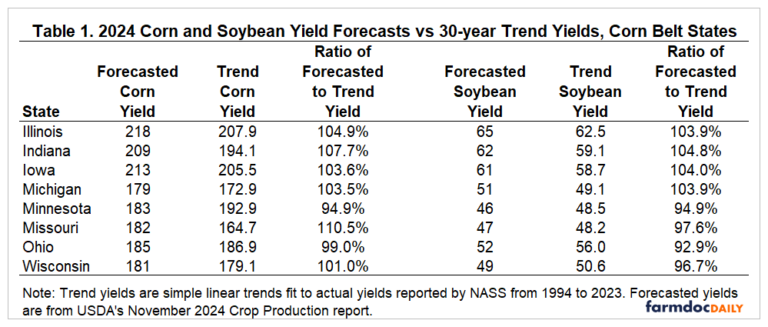
Corn and soybean yields are expected to be above expected or trend levels, on average, in many areas in 2024. Table 1 reports USDA’s latest state-level corn and soybean yield forecasts for Corn Belt region states, compared with 30-year trend yields. While state-level yields are not used in determining individual or area revenue insurance program payments, they do provide some indicator of where revenue insurance indemnities may be more prevalent and sizeable for 2024.

For corn, the statewide average yields in Illinois, Indiana, Iowa, Michigan, Missouri, and Wisconsin are expected to exceed 30-year trend yields. Corn yields in Minnesota and Ohio are projected to be below trend. For soybeans, yields in Illinois, Indiana, Iowa, and Michigan are expected to be above trend levels while soybean yields in Minnesota, Missouri, Ohio and Wisconsin are expected to be below trend.
Summary
Harvest prices for corn and soybeans in 2024 are below their respective projected prices established in the spring. For individual revenue insurance policies, the price declines (11% for corn and 13% for soybeans) are not sufficient to trigger payments at even the highest coverage level available of 85%. Yields losses, relative to a farm’s APH yield, will be required to trigger insurance indemnities on individual revenue products.
Area and supplemental area plans (ARPI, SCO, and ECO) offer higher coverage level options but are based on county yields. SCO’s 86% coverage level implies small county yield losses would be needed to trigger payments. ARPI offers up to 90% coverage while ECO coverage can be purchased as high as 95%. For both 90% and 95% coverage, county yields somewhat above expected levels could trigger area plan indemnities.
Corn and soybean yields are expected to be near or above trend or expected levels in most major growing regions for 2024. With the exception of Minnesota and Ohio, state-level average corn yields are expected to be above trend in 2024. For soybeans, yields are expected to be below trend in Minnesota, Missouri, Ohio, and Wisconsin but above trend in other Corn Belt states.
There will almost certainly be individual counties and farms that experience yield losses even in states where the average yield is expected to be above trend. Similarly, in states where the average yield is currently projected below trend there will be counties and farms with yields above insurance guarantees. Thus, while the state-level yield forecasts provide some general guidance on where we might expect to see larger and more prevalent insurance payments, individual experience will vary.
Source : illinois.edu