By Dorivar Ruiz Diaz and Lucas Haag
A number of farmers are asking some pretty difficult questions on the value of drought-damaged corn for various uses, including as feed and for soil protection. There are a number of variables that go into that answer, some of which include:
- Does the farmer have a need or market for the corn as hay or silage, which will also be influenced by plant nitrate content? (Nitrate toxicity is discussed in more detail in a companion article in this eUpdate issue.)
- The plant nutrient content of the crop and what portion of those nutrients would be available to future crops.
- The need for residue cover to prevent wind or water erosion.
- The value of additional soil moisture for future crops from maintaining residue cover.
Range of vegetative growth and grain yields
Previous data collected in Kansas on drought-affected corn used measurements of the plant stand, height, dry matter, and moisture content to estimate biomass production and nutrient uptake/value of the biomass.
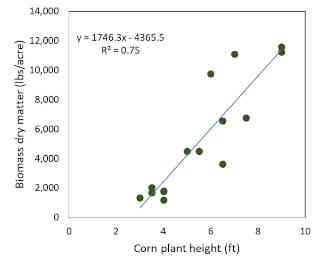
Forage yield. A general rule of thumb is that corn with <20-bushel yield potential is best used as forage, while corn with > 50 bushels per acre yield should be harvested for grain. What do these different yield levels look like? Figure 1 gives the dry matter content found in corn standing in the field (data collected in 2011) versus plant height (from the ground to the base on the tassel).

Figure 1. Dry biomass production vs. corn plant height of drought-affected corn collected in Kansas.
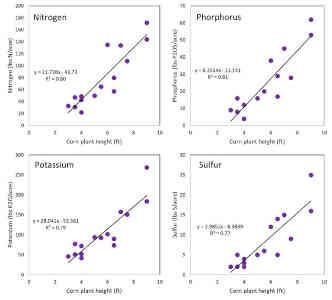
Nutrient content of the vegetation. What is the potential value of the crop left in the field for residue cover? There are several benefits that have to be considered in making that decision. The nutrient content of the plants and subsequent effects on soil test levels and fertilizer rates for next year’s crop is one factor to consider. The nutrient content of the plant material harvested in July 2011 is given in Figure 2. The nutrient content of the material is relatively high at these stages of growth and increases on an acre basis with dry matter yield. But, how do these numbers relate to future fertilizer needs?
The majority of the nitrogen (N), phosphorus (P), and sulfur (S) in plant material are generally present as protein and other organic compounds. For these nutrients to become available to plants, these compounds must be broken down and the N and P mineralized. This process will normally take 3 or more years to complete, with the C:N ratio being the primary factor controlling the release rate. Corn stalks are normally a very high C:N material, with a C:N ratio of around 60 to 1. In high C:N materials, very little net N mineralization will occur until the organisms utilizing this material as a food stuff reduce the carbon content of the residue to a C:N ratio of roughly 25:1. In these severely drought-damaged crops, the N content is much higher than normal, since there is little or no grain present. The C:N ratio in many of these severely damaged crops is less than 35:1. So net mineralization will occur much quicker, in a matter of months rather than years. In very severely damaged corn where N content is around 2% or more, roughly 50% of this N, P, and S is likely to be available for a summer crop planted next spring.
Corn silage with much more stalk and grain contains about 25 pounds K2O per dry ton. When the biomass is removed, the amount of K2O removed from the field is usually much higher than nitrogen. Potassium can leach from the residue and back to the soil in a few months and is K that will be likely available for the next crop.
Unfortunately, wheat planted this fall into these residues will not benefit nearly as much from the N, P, and S present in the vegetation as there will not be as much time for soil organisms to break the residues down and mineralize these nutrients. Winter wheat planted in October will essentially be done taking up nutrients by the end of May, when soil organisms will be getting into high gear!

Figure 2. Nutrient uptake (N, P, K and S) vs corn plant height from drought-affected corn collected in Kansas.
Source : ksu.edu