Farmers love data. And while big picture items are great, growers tell us they really want and can use local data. In addition to national and state-level statistics, some of our most popular data are the county-level agricultural production information that we collect and publish.

Collecting local data is not an easy task. For example, in Iowa, where I oversee agricultural statistics, to determine 2015 county-level numbers, we surveyed 11,500 farmers in December and January to supplement data from nearly 3,000 Iowa farmers surveyed for the January 12th Crop Production Annual Summary report. These statistical surveys are designed so all farmers in the state have a chance to be selected for participation. In order to publish county data, we need responses from at least 30 producers in each county or yield reports for at least 25 percent of the harvested acreage in a county. Luckily, here in Iowa, we received 50 or more farmer reports for many counties but we still had a couple of counties that did not make the 30 report requirement for publication.

In addition to farmer-reported acreage and yield data, NASS uses aggregated certified acreage data from USDA’s Farm Service Agency (FSA), insured acreage data from USDA’s Risk Management Agency (RMA), and the NASS satellite-based acreage data (cropland data layer) to help determine planted and harvested acreage for each county.
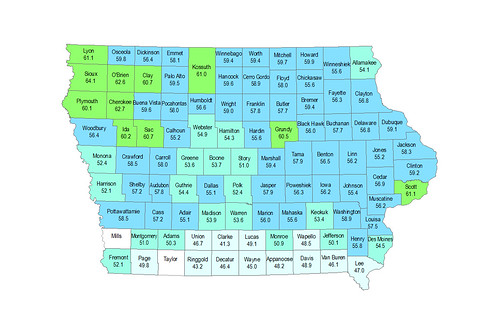
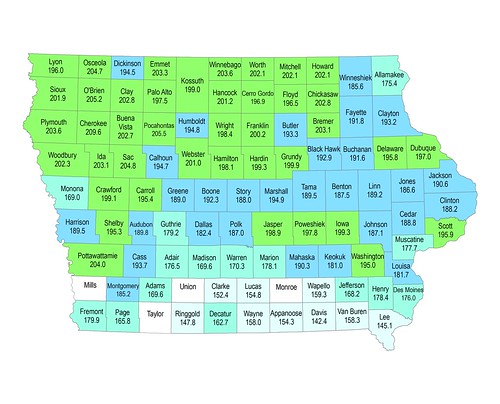
The latest county data in Iowa is pretty exciting. More than one-half of our 99 counties had record high corn yields in 2015 with average yields in 22 counties surpassing 200 bushels per acre. Four of the five highest yielding counties were in the northwest crop reporting district with Cherokee leading all counties, at 209.6 bushels per acre. Just over half of the counties also saw record high soybean yields in 2015 and 11 counties averaged more than 60 bushels per acre, led by Sioux County at 64.1 bushels per acre. Cherokee (62.7), O’Brien (62.6), Lyon (61.1), and Scott (61.1) counties rounded out the top five. Yields of less than 50 bushels per acre were recorded in 12 southern Iowa counties.
The importance of responding to NASS surveys cannot be overstated. The estimates resulting from the surveys do more than just settle arguments about which county had the highest or lowest average yield. Under the 2014 Farm Bill, FSA uses the NASS county yield data to calculate Agriculture Risk Coverage – County (ARC-CO) benchmark revenues and crop year county revenues. If the actual county crop revenue falls below the ARC-CO guaranteed revenue for a given year, an ARC-CO payment is triggered for that crop/county. So, the NASS county yield, along with the crop’s U.S. marketing year average price, are used to help determine payments for this program.
These data also help provide the T-yields farmers use for insurance purposes when actual yields are not available. They also provide the data needed to make the trend-adjusted yield endorsement available which allows producers to increase their insurance coverage. County estimates assist in determining payments for group risk insurance policies and Farm Service Agency county loan rates for the marketing loan program. County data also contribute to administering disaster assistance and conservation programs.