By Gary Schnitkey and Jim Baltz et.al
Department of Agricultural and Consumer Economics
University of Illinois
Carl Zulauf
Department of Agricultural, Environmental and Development Economics
Ohio State University
While fertilizer prices have declined since spring, fertilizer prices remain high, and fertilizer costs are significantly higher than a year ago. Therefore, reducing rates where practicable seems prudent. Some fields will have soil test levels above those that will cause a yield response from phosphorus and potassium applications. Significantly reducing or eliminating applications in these fields is economically prudent. Moreover, nitrogen applications above university recommendations can substantially reduce returns. Changes in nitrogen prices from now to spring likely will be influenced by changes in corn and natural gas prices.
Recent Prices
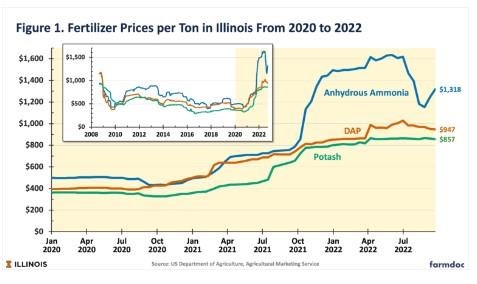
Retail fertilizer prices averaged across Illinois are regularly reported in the Illinois Production Cost Report, a publication of the USDA’s Agricultural Marketing Service. Fertilizer prices remain at high levels going into the fall of 2022. Anhydrous ammonia prices continue to surpass all-time highs reached during the 2008 financial crisis. In the fall of 2008, anhydrous ammonia reached a high in Illinois of $1,161 per ton (see Figure 1). Anhydrous ammonia prices have exceeded the 2008 previous record since October 2021. Anhydrous ammonia prices were over $1,600 per ton through April 2022, falling to $1,153 per ton on August 25, 2022. Then, anhydrous ammonia again increased, reaching $1,318 per ton on September 22.

Diammonium phosphate (DAP) and potash fertilizers also remain at high levels. DAP was over $1,000 per ton in June 2022. On September 22, DAP prices were reported at $947 per ton. Potash prices have remained relatively stable at high levels, with a price of $857 per ton reported on September 22, 2022.
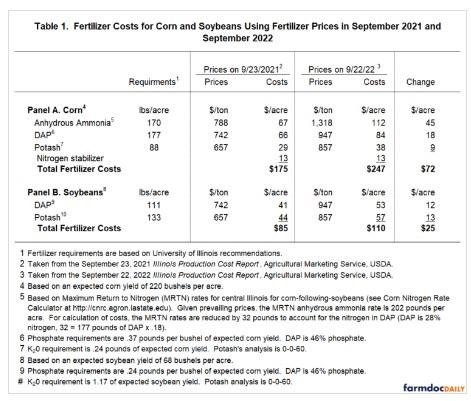
While ammonia and DAP prices have declined since spring, current fertilizer prices are higher than last year and will result in higher fertilizer costs than last year. Table 1 shows fertilizer costs computed using prices from one year ago on September 23, 2021, and current-year prices on September 22, 2021. As can be seen, anhydrous ammonia prices were $788 per ton last year and are now $1,318 per ton. As a result, anhydrous ammonia costs for corn increased from $67 per acre using 2021 prices to $1132 per acre using 2022 prices.
Table 1 gives fertilizer costs for corn and soybeans produced on farmland with expected yields of 220 bushels per acre for corn and 68 bushels per acre for soybeans. The Corn Nitrogen Rate Calculator was used to determine corn’s Maximum Return to Nitrogen (MRTN) rates. After accounting for the nitrogen in DAP, the MRTN rates resulted in applications of 170 pounds of anhydrous ammonia. Phosphate and potash rates are based on maintenance levels (see Nafziger, farmdoc, September 7, 2017).

Fertilizer costs for corn were $175 per acre using September 23, 2021 price and increased by $72 per acre to $247 per acre using September 22, 2022, prices. Soybean costs increased from $85 per acre to $110 per acre, an increase of $25 per ton.
Individual farm costs could vary from those shown in Table 1, with the following being the most likely causes:
- Timing of purchase. Last year, fertilizer prices increased from fall 2021 to spring. Farmers who purchased fertilizer later generally had higher costs. A similar trend may not occur in 2023 (see farmdoc daily, July 19, 2022).
- Choice of ammonia source. Table 1 bases costs on applying anhydrous ammonia in the fall. As a result, nitrogen stabilizer costs of $13 per acre were included. Anhydrous ammonia generally has lower costs per pound of actual nitrogen when compared to either nitrogen solutions or urea. The use of different nitrogen sources or eliminating nitrogen stabilizers because of post-plant applications will alter costs.
- Difference in rates. Differences in rates will change costs, as elaborated on in the following sections.
Phosphorus and Potassium Rates
Table 1 uses DAP and potash application rates at replacement levels, assuming that soil test levels are in maintenance ranges. According to the Illinois Agronomy Handbook, corn and soybean yields are not dependent on phosphorus applications if Bray P levels exceed somewhere between 60 and 70 pounds per acre (see Figure 8.5 of Illinois Agronomy Handbook). If soil tests are above that level, phosphorus applications are not needed to maintain yields. Similarly, corn and soybean yields are not dependent on potash applications when potassium levels exceed between 360 and 400 pounds per acre (see Figure 8.8 of Illinois Agronomy Handbook).
Many fields have soil test levels above those where yields will respond to fertilizer applications. In these situations, cutting or eliminating applications is warranted in any year, particularly in high-price years like this year. Some may be reluctant to forgo fertilizer applications on rented farmland, as agreements may specify that test levels of nutrients must be maintained. Revisiting those agreements seems warranted if soil test levels are above levels where yield response exists. Neither the farmer nor the landowner receives any gains from this application. Moreover, a reduction in fertilizer applications would be preferred from an environmental standpoint, as higher soil test levels potentially increase phosphorus and potassium runoff if soil erosion occurs.
Even if soil test levels are below response levels, reducing phosphorus and potassium applications may still be warranted. In recent years, estimates of removal rates on grain have been lowered (see Nafziger, farmdoc, September 7, 2017). Checking to see if soil test levels exhibit an increasing trend over time suggests application rates can be reduced.
Nitrogen Application Rates
Maximum Return to Nitrogen (MRTN) rates for a $5.50 corn price and $1,318 anhydrous ammonia price are (see Corn Nitrogen Rate Calculator):
- 157 pounds of actual nitrogen in northern Illinois,
- 166 pounds of actual nitrogen in central Illinois, and
- 185 pounds of actual nitrogen in southern Illinois.
Many farmers apply above those rates. Data from Precision Conservation Management confirm that profit-maximizing levels are at MRTN, and thus profits can be increased by reducing nitrogen applications to the MRTN.
Timing of Nitrogen Purchases
Some farmers are considering waiting until later in the spring, with hopes that nitrogen prices will decline. As indicated in earlier articles (farmdoc daily, December 14, 2021), anhydrous ammonia prices are highly related to corn and natural gas prices. The correlation coefficient between ammonia and corn prices is .71. The correlation coefficient between ammonia and natural gas prices is .61 (see Figure 1).
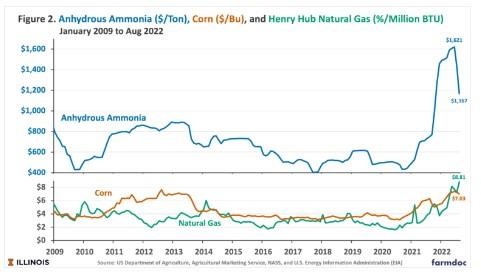
Currently, corn and natural gas prices are at high levels. Compared to September 2022 levels, corn prices were only slightly higher in 2012 and 2013 (see Figure 2). Current natural gas prices have been at levels not exceeded since 2009 (see Figure 2). As a result, one should expect to see high anhydrous ammonia prices. If anything, anhydrous ammonia prices are low relative to current corn and natural gas prices. Historical relationships would suggest anhydrous ammonia prices near $1,400 while current anhydrous ammonia prices are near $1,300 per ton.

Both corn and natural gas prices could decline into spring. Chicago Mercantile Exchange (CME) futures contracts suggest natural gas prices near $6 per million BTUs, while the August average was $8.81. A decline to $6 per million BTUs would suggest an anhydrous ammonia price of $1,200 per ton. Of course, much can change between now and spring. A cold winter likely would lead to higher natural gas prices. Events in the Ukraine-Russia war also will have a bearing on prices.
Splitting nitrogen purchases is a sound risk management strategy in this situation. However, if farmers are concerned about applying nitrogen post planting, a new crop insurance policy, Post Application Coverage Endorsement (PACE), exists to cover risks (see farmdoc daily, January 18, 2022).
Summary
Fertilizer prices remain high and will result in high fertilizer costs for 2023. Reducing rates seems prudent in several situations. Phosphorus and potassium applications can be reduced or eliminated if soil test levels are sufficiently high. Nitrogen rates should be done at MRTN levels. Significant uncertainty exists concerning fertilizer prices moving into spring.
Source : illinois.edu