By Gary Schnitkey and Nick Paulson
Department of Agricultural and Consumer Economics
University of Illinois
Carl Zulauf
Department of Agricultural, Environmental and Development Economics
Ohio State University
Interest rates on agricultural loans have increased as the Federal Reserve Bank (FED) has raised rates to combat increased inflation. Given different inflation rate scenarios, we present scenarios of possible interest rates on agricultural loans. If the FED achieves its 2% inflation goal, interest rates on agricultural operating loans could be between 6% and 8.2%, roughly at current levels. Higher interest rates are likely if high inflation rates continue to persist.
Approach
Potential interest rates in the future will be evaluated using historical relationships between three series:
- The Consumer Price Index for urban consumers, excluding food and energy, will be used to measure inflation. This index will hereafter be referred to as headline inflation.
- Ten-year Constant Maturity (Ten-year CMT) US Treasury bond rate will be used to measure general interest rates across the U.S. economy. The spread between interest rates and inflation, the ten-year CMT minus inflation, will be examined from a historical perspective.
- Variable rates on agricultural operating notes in the Tenth Federal Reserve District will be used to represent agricultural rates. The agricultural rate spread, operating note rates minus the ten-year CMT, will represent a risk premium and intermediation cost measure for agricultural loans.
Future interest rate projections are then based on inflation rate scenarios plus historical interest rate and agricultural rate spreads.
Inflation Rates
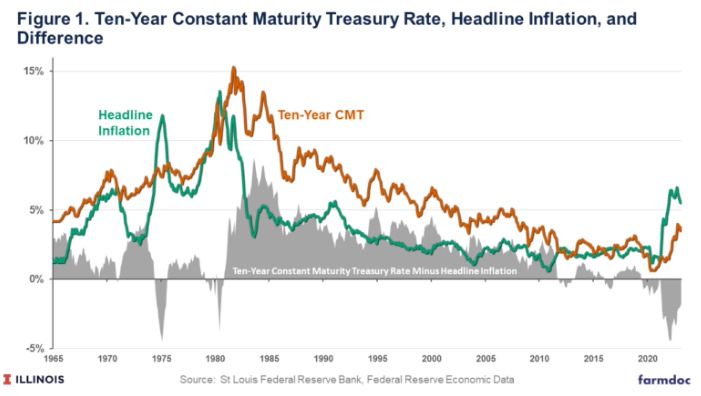
After a high period of inflation in the early 1980s, headline inflation declined, reaching relatively low levels from 2000 on (see Figure 1). From 2010 to 2019, headline inflation averaged 1.9%. Maintaining this low inflation rate was remarkable, given monetary and fiscal policies implemented over that period. Following the 2008 financial crisis, the FED followed an accommodative monetary policy, resulting in low-interest rates. Quantitative Easing (QE) was also instituted in 2008, a program by which the FED purchases Treasuries and other assets, thereby providing liquidity to the market. Fiscal policy also was expansionary, with Federal deficits averaging 4.8% of GDP.

From a 1.3% level in February 2021, headline inflation increased substantially, reaching a high of 6.6% in September 2021, the highest level since the 1980s (see Figure 1). Several events and factors are associated with this inflationary period. First, the Covid-induced recession ended, introducing inflationary pressures as individuals again began to purchase goods, leading to supply-chain disruptions and higher prices. Large Federal deficits occurred throughout 2020 and 2021. Moreover, the FED continued to increase its balance sheet through April 2022. Furthermore, the Ukraine-Russia conflict occurred and increased both energy and agricultural commodity prices.
From the 6.7% level in September 2021, headline inflation declined to 5.5% in February 2022. The FED followed a policy of increasing interest rates, attempting a return to a target inflation rate of 2.0%, roughly the same as from 2010 to 2019. Recent declines in headline rates are encouraging, but continued declines to 2% are not guaranteed. A debate exists on whether inflation is transitory and will continue to decline or continue to remain at elevated levels more permanently. While supply-chain disruptions likely are transitory, labor markets continue to be near full employment, partially due to demographic factors causing a reduced labor supply. Continued wage increases could result in higher inflation levels.
The following scenarios will be examined:
- 0% inflation rate — the stated goal of the FED,
- 5% inflation rate — representing inflation above target but lower than current levels due to ongoing labor market pressures,
- 0% inflation rate — representing continued inflationary pressures at current levels.
Ten-year CMT
Ten-year CMT rates have increased from 1.3% in February 2021 to 3.7% in February 2023 (see Figure 1). The last time a ten-year CMT was above 3.7% occurred in 2010.
While high relative to recent experience, the ten-year CMT rate is below its typical relationship with headline inflation. The ten-year CMT rate is typically above the headline inflation rate (see Figure 1). From the mid-1980s through 2012, the difference between the ten-year CMT and headline inflation narrowed, likely because inflation was declining. Expectations were for continued stable inflation rates. From 2010 to 2019, the ten-year CMT averaged .6% above headline inflation.
There have been periods in which the ten-year CMT rate was below headline inflation: 1974 — 1975, 1979 — 1980, 2011 — 2012, 2016, and 2019 — 2022. These periods typically occurred as inflation rates increased, leading to market adjustments. Eventually, ten-year CMT rates average higher than headline inflation.
The current 2020-2023 period is unusual in its length, with ten-year CMTs being below headline inflation for over three years. This long period likely is due to unique times: a Covid-induced recession and rebound, combined with accommodative fiscal and monetary policies.
Currently market participants in ten-year CMT markets appear to believe that inflation will fall. The inputted ten-year inflation rates from financial markets is at 2.28% (see FRED). The inputted inflation rate over the next year is 2.07% (see FRED). Whether those expectations unfold remains to be seen.
We will examine two interest rate spreads:
- 6% representing the average from 2010 to 2019.
- 2% represents the average spread from 2005 to 2007. The 2005-2007 period represents a period of less accommodative monetary and Fiscal policy.
Agricultural Lending Rates
The Kansas City FED conducts a quarterly Survey of Agricultural Credit Conditions, including the publication of variable interest rates in the Tenth Federal Reserve District. The Tenth District includes states in the Great Plains (Oklahoma, Kansas, Nebraska), Rocky Mountains (Colorado, Wyoming), and some counties in Missouri and New Mexico. While not the Corn Belt, rates in the Great Plains likely are highly correlated to rates faced by Midwest farmers.
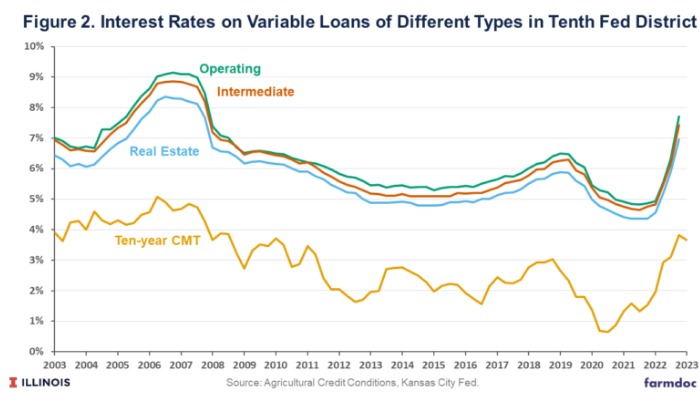
Rates are given for operating, intermediate, and real estate loans. All three of these rates are highly correlated (see Figure 2). Rates on operating notes reached lows in 2021 of below 5.0%. Rates began to rise in the second quarter of 2022 (5.6%) and continued to increase in the third (6.3%) and fourth quarters (7.7%)

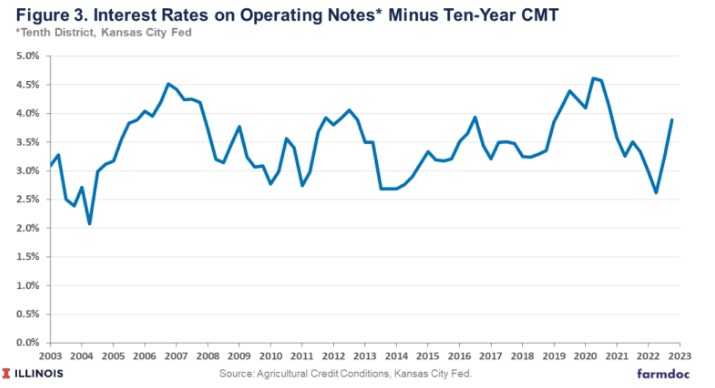
Agricultural operating rates minus ten-year CMT rates averaged 3.4% from 2003 to the present, with no discernible upward or downward trend (see Figure 3). The highest difference was 4.6%, occurring in the second and third quarters of 2022. The lowest difference was 2.1% in the second quarter of 2004.

Overall, the average difference between agricultural operating notes and the ten-year CMT is about 3.4%. This spread reflects risks associated with agricultural lending and costs associated with financial intermediation to farmers. We will use a 3.4% spread in presenting future agricultural interest rate scenarios. Not increasing rates suggest that default rates will not change, a likely scenario if current agricultural returns do not decline.
Future Interest Rate Scenarios
Inflation rates will influence future interest rates.
2% inflation rate: The 2% inflation rate is the FED’s goal. Interest rates on agricultural loans likely would be between
- 6% (2% inflation rate + 0.6% spread on ten-year CMT and inflation + 3.4% spread on operating notes and ten-year CMT) and
- 7.8% (2% inflation rate + 2.2 spread on ten-year CMT and inflation + 3.4% spread on operating notes and ten-year CMT).
A 6% likely would be associated with accommodative policy like that which occurred between 2010-2019. A 7.8% would be associated with a less accommodative policy like occurred between 2005 and 2007.
3.5% inflation rate: A 3.5% inflation rate would likely result in interest rates on agricultural operating loans being between 7.5% and 9.1%, rates that are above those since 2006 and 2007.
5.0% inflation rate: A 5% inflation rate would likely result in the interest rate on agricultural operating loans between 9.0% and 10.6%.
Summary
If the FED reaches its goals of a 2% consumer price inflation rate, interest rates on agricultural loans likely would be in the 6% to 7.8%, roughly at levels experienced in 2018 and 2019, the period immediately before Covid. However, higher rates are likely if inflation is higher. Current levels of the ten-year CMT suggest that market participants expect inflation to decline from current levels. Whether this will occur remains to be seen.
The above analysis assumed that historical relationships between interest rates and inflation will occur in the future. While likely, this implies that there are no risk changes in agricultural loans.
Source : illinois.edu