By Joe Janzen and Jonathan Coppess
Department of Agricultural and Consumer Economics
University of Illinois
High input costs have reinvigorated arguments in Congress for farm support programs where payments are triggered when the cost of production rises. Historically, cost of production has been a focus of farm policy in periods of elevated price inflation (farmdoc daily, September 15, 2022) Farm input prices, particularly for fertilizer and fuel, have been high and volatile in the past year. Recent shocks to energy markets including the rupture of the Nord Stream pipelines (Kantchev, September 27, 2022) and the announcement by the Organization of the Petroleum Exporting Countries that member nations would cut crude oil production by as much as two million barrels per day (Reed, October 5, 2022) are likely to create further input price volatility and stoke additional requests for farm programs that incorporate production costs.
The current discussion around such policies has focused on the concept of margin, the difference between revenues and production costs. In a previous article, we considered pitfalls in defining the costs of production to be included in the margin calculation used in determining farm program payments. The cost of production is “elusive” in part because the input cost structure varies; some types of costs matter more for some commodities than others.
In this article, we examine another way in which production costs are perhaps more elusive than other quantities such as output prices or revenue used to trigger current crop program payments. We show that production costs vary across regions and across time in ways that make it difficult to develop a single margin calculation relevant to all producers. Specifically, we show that i) production costs vary substantially across regions and across commodities, and ii) production costs vary across regions and time in ways that make margins more variable than prices and revenue.
Background: Production Cost Data
USDA’s Economic Research Service reports data on costs and returns for major agricultural commodities, including crops like corn, cotton, rice, soybeans, and wheat. USDA reports price and yield for primary outputs and revenue for all products (e.g. both grain corn and corn silage, cotton fiber and cottonseed, wheat and wheat straw, etc.) Production costs are divided into two main categories: operating costs and costs for allocated overhead.
USDA reports both national average per-acre revenues and costs, as well as region-specific cost and return estimates. USDA cost and return data are useful in large part because they are constructed in a consistent manner across production regions. Regional estimates are available at the level of the USDA farm resource region (see ERS, USDA). These regions divide the continental US into 9 areas by agricultural production characteristics. Cost and return estimates are available when there is significant production of a given commodity in a region. For example, cotton production estimates are available for most areas of the US south, but not for the northern Great Plains and other areas where cotton production is negligible.
Production Cost Differences By Commodity And Region
Crop production costs vary substantially across the United States. Vertical lines in Figure 1 show the range of operating costs for each crop commodity across different US production regions defined by USDA. Not only do production costs vary regionally, but the nature of these regional differences also differs by commodity. While the range of outcomes is smaller for crops with lower per-acre operating costs like soybeans and wheat, the range of outcomes also varies as a percentage of the national average. For corn, operating costs range from 14% below to 24% above the national average. For soybeans, operating costs range from 19% below to 35% above the national average. In the extreme case of cotton, operating costs in some regions are estimated to be 70% higher than the national average.
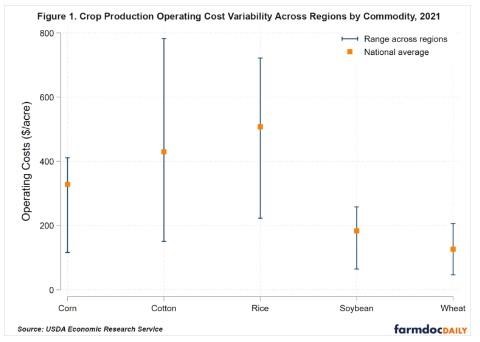
Large differences in operating costs across commodities suggests that a national margin protection program for crops may need to be more complex than existing margin programs like the dairy margin coverage program which uses a single national measure of dairy feed costs to calculate margins. Variation in operating costs across regions shown in Figure 1 suggests a margin-based farm program for crops would need to be complex enough to account for these differences or would be poorly targeted to actual changes in farm-level profitability.
If regional differences in production costs are ignored, some regions will be undercompensated or overcompensated relative to others, leading to disputes about the fairness and equity of the program. Regional disparities in program payments were at the center of debates about the merits of trade aid delivered through the Market Facilitation Program from 2018 to 2020 (See farmdoc daily, October 8, 2020).
The Contribution of Regional Production Cost Differences to Margin Variability
How difficult would it be to account for production cost differences across regions and commodities in a farm program where program payments were triggered by changes in margin? To shed light on this question, we describe the variation in the components of calculated per-acre margins (equal to total crop revenue from primary and secondary products minus all operating costs) for all production regions where USDA cost and return data are available. We present these data for three crops – corn, cotton, and wheat – in Figures 2-4. We highlight the national level estimates as well as those for corn and wheat in the Corn Belt region which encompasses all of Illinois, Indiana, and Iowa plus parts of Kentucky, Minnesota, Missouri, Nebraska, Ohio, and South Dakota. (USDA calls this the “Heartland” region; since the name “Corn Belt” is more widely used to refer to this area in agricultural media, we use the latter term.) For cotton, we highlight outcomes for the Southeast region which includes
The top left panel in each figure shows price differences across regions. These differences are small and do not vary much over time. This is especially true for corn. For cotton and wheat, the specialization of regional production explains much of the differences in observed prices. For example, California grows higher value types of cotton and the Northern Great Plains grows higher value classes of wheat. However, prices are comparatively homogeneous across regions relative to other measures of farm profitability implying that price-based farm programs such as the current Price Loss Coverage (PLC) program can be targeted to realized outcomes for farms across the country using information on national-level prices only.
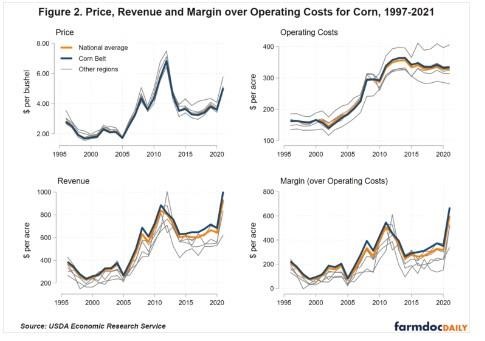
Crop revenues shown in the bottom left panel of Figures 2-4 show that revenues vary much more across regions than prices. Persistent differences in crop yields do create revenue differences across regions over time. For instance, Corn Belt revenues exceed the national average in every year. However, year-to-year yield variability leads to shifts in the relative position of regions in the distribution of revenues in different years.
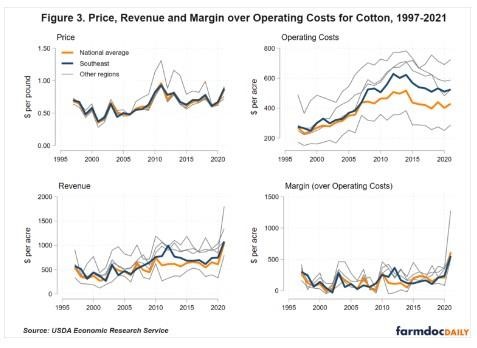
Consistent with the data for 2021 observed in Figure 1, operating costs differences across regions are observed for all years in the top right panel of Figures 2-4. Production cost differences across regions are more stable than revenue differences. However, operating costs and revenues are not perfectly correlated. In addition, operating cost changes over time may be unique to a region due to region-specific changes in production practices or changes in regional input prices. For example, corn operating costs in most regions (including the Corn Belt) are strongly correlated with movement in the national average measure of operating costs. However, this correlation is not perfect: regions do change places in the distribution of production costs. In the top right panel of Figure 4, for example, we see that operating costs for wheat production in the Corn Belt are now well above the national average per-acre cost whereas 20 years ago they were proportionally much closer to the national average.
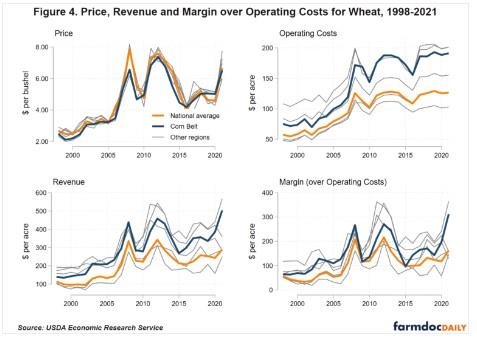
Combining variation in prices, yield, and operating costs into observed variation in margins (shown in the bottom right panel of Figures 2-4) demonstrates that margin is more variable than any of its components. Variability relative to the national average is approximately 1.5-4 times greater for margins than for revenue. Higher variability across regions and time in margins implies that targeting payments to realized losses will be more difficult for a margin-based program than a revenue-based program such as the current Agricultural Revenue Coverage (ARC) program. Again, this increases the likelihood of disputes related to program equity across producers.
Imperfectly targeted program benefits of a prospective margin-based farm program that uses national-level margin calculations also creates risk management issues for producers. Such basis considerations were highlighted in an early analysis of the dairy margin program discussed above (Newton 2014) While program benefits make farmers better off in aggregate, changing differences between national and local margins may create hard to manage risks for farmers. For example, regional margins may actually fall when national average margins rise, something periodically observed in the margin panel of Figures 2-4. If farmers expect regional margins to move in the same direction as national margins, they may not take other measures to mitigate this margin risk.
Conclusion
In this article, we examined another way in which production costs are perhaps more elusive than other quantities relevant to farm profitability and the perceived need for farm program payments. Current Title I farm programs (PLC and ARC) use either crop prices or revenue to calculate program payments. Production costs vary across regions and across time in ways that make it difficult to develop a single margin calculation that is relevant and targeted to realized losses at the farm level. We show that i) production costs vary substantially across regions and across commodities, and ii) production costs vary across regions and time in ways that make margins more variable than prices and revenue. Cost differences across regions may generate inequities in program benefits that can either be addressed through more complex program design or ignored. Imperfect targeting of margin-based program benefits to individual farms may also have implications for farmer risk management decisions.
Source : illinois.edu