By James Mitchell
Last week USDA-NASS published their annual March Prospective Plantings report. The report provides initial insights on farmer’s planting intentions for the 2021 crop. There were a few bullish surprises in this report that are worth discussing.
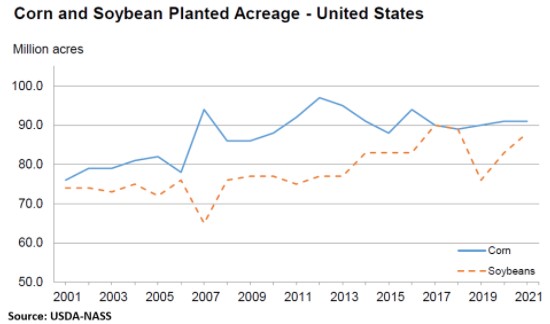
The above graph plots corn and soybean planted acreage with 2021 estimates. Corn planted acreage is estimated at 91.1 million acres, a 0.4 percent increase over last year. Most of the corn belt intends to plant fewer acres to corn this year. Corn planted acres are estimated down 4 percent in Illinois and Indiana and down 3 percent in Iowa. Corn planting intentions are down 5 percent in Kansas and 3 percent in Nebraska. Overall, planted acreage is expected to be up to unchanged in 24 states. While the report indicates that farmers intend to plant more corn in 2021, estimates were well below pre-report expectations.
Soybean planted acreage is estimated at 87.6 million acres, a 5.4 percent increase over 2020. An increase of 3.9 percent, 4.3 percent, and 1.8 percent are estimated for Illinois, Iowa, and Indiana, respectively. Soybean planted acreage in North Dakota is estimated to be up 21.7 percent compared to 2020. In Arkansas, planted soybean acreage is expected to be up 6 percent. Again, while farmers intend to plant more soybeans in 2021, estimates were below expectations.
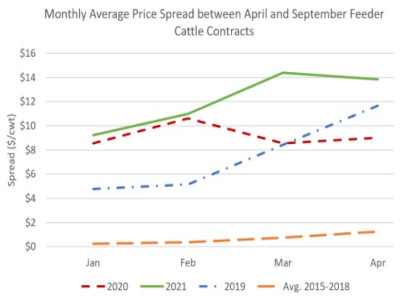
A major talking point this year has been rising feed prices and the implications for livestock markets. Last week’s report points towards a higher cost of gain, and feedlots will respond to these impacts. One alternative that Kenny has touched on is the potential to add weight outside of feedlots in a summer grazing program. For April placement on grass, a crude way to examine the market signals for this type of program is to monitor the futures price spread between the April and September contracts prior to the April contract expiration. A positive difference indicates a potential signal to retain through the summer. Historically, the spread in March has averaged $0.75/cwt. This year the April-Sep spread averaged $14.40/cwt in March and is currently $13.85/cwt. There are several other factors to consider, such as forage availability, but this is one positive indicator.
Source : osu.edu