By Jonathan Coppess
The 2018 Farm Bill produced a rare setback for natural resources conservation policy. The current suite of conservation programs are all built out of the landmark Food Security Act of 1985, which created the Conservation Reserve Program and conservation compliance; policy that is rooted in the response to the Dust Bowl of the 1930s and the farm policy controversies in the 1950s. Conservation policy is a critical component of the farm bill policy framework and its supporters are key allies in the farm bill coalition. The setbacks in 2018 raise concerns and questions that are likely to become more critical as farmers face increasing challenges in the coming years. Farmers have once again been thrust into volatile geopolitical and trade conflicts. Arguably more consequential, the future for farming is complicated by demands for better sustainability and the existential risks presented by climate change. To provide perspectives on these issues, as well as food for policy thought, this article initiates a series discussing conservation policy.
Background
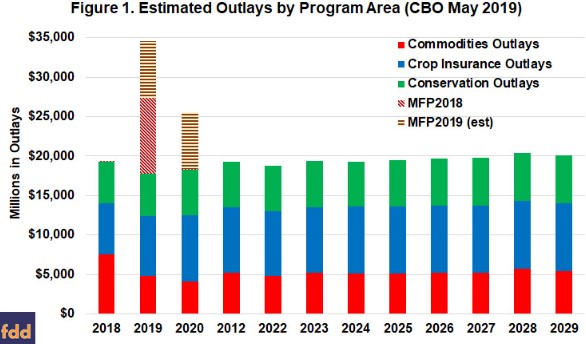
Figure 1 illustrates the estimated outlays by program area (commodities, crop insurance and conservation) as reported by the Congressional Budget Office (CBO) in its May 2019 Baseline (CBO,
May 2019). Note that the Market Facilitation Program (MFP) created by the Trump Administration in 2018 to help offset the damage from the tariff conflict was reported by CBO but it has been separated in Figure 1 because it is not authorized directly by Congress in the Farm Bill. In addition, the Trump Administration has announced and begun making payments for an even larger MFP in 2019; reported at $14.5 billion split over three payments that would be obligated in FY2019 and FY2020 based on the news release (USDA,
Market Facilitation Program). Those MFP2019 payments are included in Figure 1 as estimates based on the USDA announcement and separate from the other programs because they are also not authorized by Congress in the farm bill. Two things are immediately apparent in Figure 1. First, MFP payments dwarf all other assistance to farmers, pushing total FY2019 outlays to nearly $35 billion. Second, conservation outlays make up the smallest share of all outlays shown.

For conservation, the 2018 Farm Bill eliminated the Conservation Stewardship Program (CSP) as a stand-alone, acreage-based program and combined it with the Environmental Quality Incentives Program (EQIP) under a division of the allocated baseline (farmdoc daily,
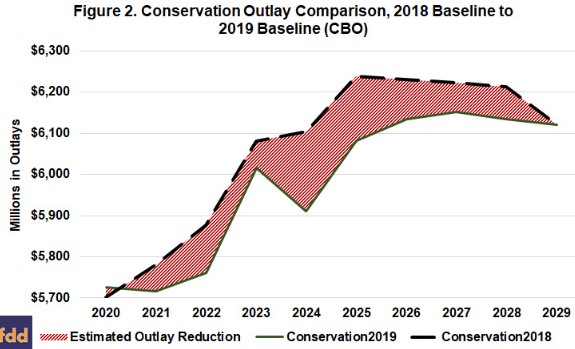
December 12, 2018). Figure 2 illustrates the difference in baseline for conservation by comparing the May 2019 Baseline in Figure 1 with the pre-farm bill baseline from April 2018 (CBO,
April 2018). Figure 2 covers only fiscal years 2020 through 2029 and the estimate for 2029 in the 2018 Baseline is set equal to that in the 2019 Baseline; CBO did not estimate outlays for 2029 in the 2018 Baseline. In total, conservation programs are expected to lose about $815 million in outlays from 2020 to 2029, although the outlays for 2020 will incur an increase of $26 million.

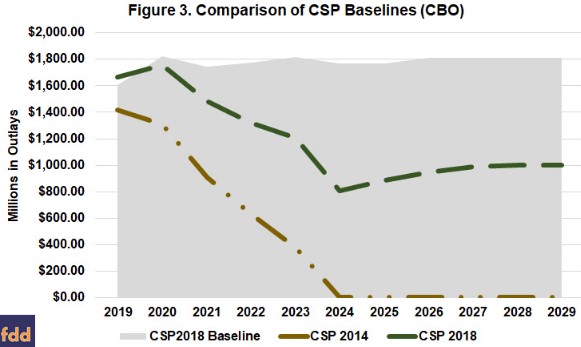
The key to the reduction in estimated outlays is CSP, as illustrated in Figure 3. CBO reported outlays for the 2014 Farm Bill version of CSP that was terminated; existing five-year contract obligations continue through fiscal year 2024, phasing down as they expire without renewal (brown line with dots). The 2018 Farm Bill version of CSP increases over time to $1 billion per fiscal year by 2028 (dark green dotted line). These two lines are stacked, such that the 2018 program outlays are added on top of the 2014 program outlays, increasing total CSP outlays in fiscal year 2019. The CSP 2018 Baseline is in the background (gray area) and Figure 2 illustrates the overall reduction in CSP outlays due to the changes in the 2018 Farm Bill. According to the CBO figures and presuming that the 2014 version of CSP had continued in 2029 at $1.808 billion, the total reduction in CSP outlays illustrated in Figure 3 would be nearly $6.5 billion over the 10 years.

By comparison, EQIP outlays are estimated to increase significantly under the 2018 Farm Bill. Figure 4 illustrates the comparison for EQIP in the 2018 CBO Baseline to the 2019 CBO Baseline. If these estimated outlays actually take place they would represent a total increase of $1.4 billion over the 10 years; a significant increase but not enough to offset the overall reductions in CSP outlays for the conservation title baseline (Figure 2).
Discussion
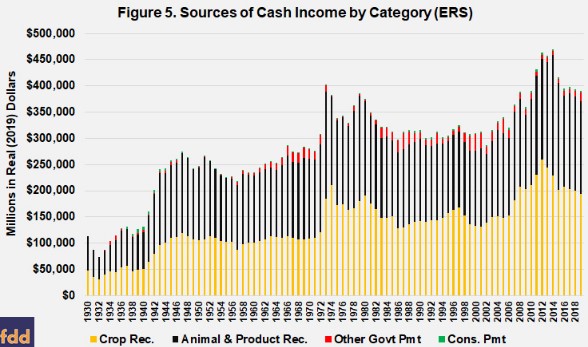
The baseline comparisons above are CBO’s best guess about these programs in the future; they provide only one component of the picture. Payments to farmers from government programs—including conservation and commodities programs—represent cash income to the farmer, but also investments of public funds provided by taxpayers. Figure 5 places conservation payments into context, both historical and as a source of cash income. Figure 5 illustrates cash income as reported by the Economic Research Service dating from 1930 to the 2019 forecast (ERS, Data Files, Income and Wealth Statistics). It compares income from crop receipts and the receipts from animal and related products with conservation payments (green) and all other government payments (commodities, ad hoc and supplemental payments). All income has been adjusted for inflation by ERS and illustrated as real (2019) dollars. Clear from Figure 5 is that income from government payments—both conservation and all other payments—constitute a relatively small share of farm income.

Clarity regarding government payments and farm income is difficult in Figure 5. To provide better perspective, Figure 6 compares payments from conservation programs and all other government payments as a percent of the total income (all commodities receipts plus government payments) for the years 1930 to the 2019 forecast. The total income from all commodities receipts in Figure 6 (gray area) is equal to the orange and black bars in Figure 5, adjusted for inflation to real (2019) dollars.

Figure 6 is also informative regarding payments and the history of policy. Total government payments have exceeded 10% of this measure of total income only four times in the entire history represented here. First, in 1987, total government payments reached nearly $33 billion on total income from all commodities of $279 billion (10.56%). Conservation payments were just over $3 billion (0.97%). Payments exceeded ten percent in 1999 (10.28%), 2000 (10.78%) and 2001 (10.08%) when Congress created Market Loss Assistance that doubled the annual contract payments created by Congress in the 1996 Farm Bill (see, farmdoc daily, September 6, 2019; Coppess 2018). Income from all commodities was just over $276 billion for 1999 and 2000, increasing to $281.5 billion in 2001. Conservation’s share, however, was below one percent all three years: 0.71% in 1999 ($2.2 billion); 0.75% in 2000 ($2.3 billion); and 0.86% in 2001 ($2.7 billion).
For 2019, ERS forecasts over $371 billion in total income from all commodities receipts and $19.5 billion in total government payments (4.99%), of that $3.6 billion (0.93%) from conservation payments. The 2019 forecast represents a decrease from 2018 ($380 billion) and is well below the average cash income from 2009 to 2018 of nearly $405 billion. It also represents a significant increase in payment levels as compared to this relatively lower level of commodities income. Total government payments averaged 3.04% from 2009 to 2018, but conservation payments represented 0.94%; a period representing the previous two farm bills. If total MFP payments are included, adding in an estimated $7.25 billion for the MFP 2019 payments for fiscal year 2019 (increasing other government payments to above $23 billion), the total percentage of income from government payments increases to a level equal to 6.79% of total income; the conservation share would be 0.92% of the total.
For conservation, Figure 6 provides more food for thought. First, compare conservation payments to payments from the other government programs. In only two eras of farm policy history are conservation payments a larger share than other payments. The first time coincides with the Dust Bowl years of the late 1930s into World War II, specifically from 1937 to 1943. The second time coincides with the early post-war years, specifically 1947 through 1955. Notably, actual conservation payments generally decrease in those years (1947-1955) but other government payments were much lower while income from commodities continued at relatively elevated levels. Beginning with 1956, however, conservation payments do not represent a larger source of income than other government payments in any year.
Excluding the Dust Bowl, conservation payments have also experience only two noticeable increases. The first begins in 1986 due to the 1985 Farm Bill creating CRP. Conservation payments compared to income jumps from under 0.15% to nearly 1% by 1987, and remains above 1% through 1994. The second can be seen after the 2002 Farm Bill created CSP and increased the CRP acreage cap. Conservation payments compared to income generally fluctuates around the 1% level through 2018.
In addition to the overall levels of payments as compared to the income from commodities, Figure 6 also highlights a stark difference between conservation payments and other government payments. Other government payments are highly variable from year to year. This is due to the counter-cyclical nature of farm program payments. In years of strong prices and income, these payments typically decrease both in actual dollars and as a share of income but reverse course when incomes fall, increasing both in actual dollars and as a share of income. Conservation programs do not respond to these income or market features; spending remains relatively steady, changing only as Congress revises programs or creates new programs.
Concluding Thoughts
Return to the bottom line: payments to farmers from government programs—including conservation and commodities programs—represent cash income to the farmer, but they are also investments of public funds in farming provided by taxpayers. This should anchor the conversation and inform all thinking about the conservation question. The 2018 Farm Bill has indicators of being an inflection point; the direction going forward is uncertain, however. This series will explore perspectives on the history and development of conservation policy, seeking to inform discussions about the policy and farming going forward into a challenging future.
Source : illinois.edu