By Krista Swanson, Jonathan Coppess, Gary Schnitkey
Department of Agricultural and Consumer Economics
University of Illinois
and
Carl Zulauf
Department of Agricultural, Environmental and Development Economics
Ohio State University
Soybeans and other U.S. agricultural products have been a prime target for retaliatory tariffs throughout the ongoing trade conflict. As examined in Part I of this two-part series, implementation of tariffs has resulted in reduced exports of targeted agricultural commodities and reduced demand, pushing farm level prices lower (farmdoc daily,
April 11, 2019). In Part II, we assess the impact of the trade disruptions and retaliatory tariffs on the Illinois agricultural industry in 2018 by estimating the difference between actual and expected prices for four Illinois commodities that account for most of Illinois’ value of agriculture production: soybeans, corn, hogs, and beef cattle.
Price as a Driver in Value of Production
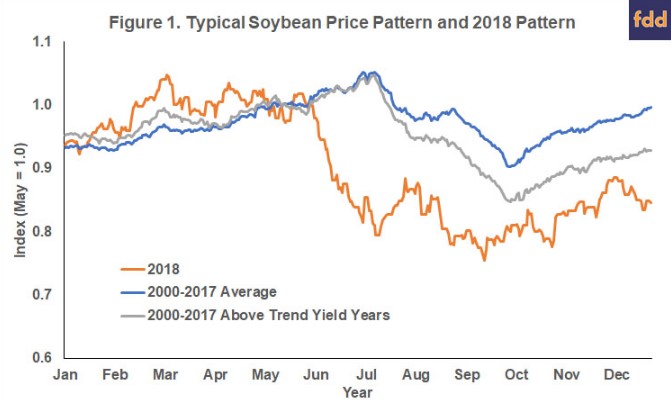
Given the heavy reliance on export markets and China as a customer, soybeans are among the commodities most impacted by the trade conflict. In this example, 2018 soybean prices are compared to a historical average. Using an index and daily soybean prices for Central Illinois from the United States Department of Agriculture Agricultural Marketing Service, a typical soybean price pattern is compared to 2018 monthly prices. The typical soybean price pattern is represented by the daily average price from 2000-2017, by month in Figure 1. Significant deviation from the average is evident from June through December 2018. However, the above trend yields in 2018 would likely push prices lower than the average price yield. The 2018 price pattern is also compared to the average prices of the 2000-2017 years with yields above trend in Figure 1. As expected, the price pattern of above trend years begins to drop below the average in July, when yield potential is realized. Notably, in 2018, the decline from a typical pattern begins earlier in the growing season and is more pronounced than a typical above trend yield year.

Analysis Method: To estimate the impact on Illinois agriculture in 2018, we use statistical analysis of historical price and production data to estimate the expected fall price for four major Illinois commodities and compare expected fall price to actual fall price for each. Expected prices take into consideration the higher production levels that occurred in 2018 as compared to a typical year. We then extrapolate those difference between expected prices and actual prices to total Illinois production.
For soybeans and corn, a regression is used to compare a ratio of United States trend yield to United States actual yield by year to a ratio of the Crop Insurance Predicted Price and Crop Insurance October price by year. For pork (hogs) and beef (cattle), a regression is used to compare a ratio of United States inventory to United States trend inventory by year to a ratio of United States October to United States May price per hundredweight by year, with an adjustment to get a relative Midwest price and the assumption of 270 market weight for hogs and 1300 market weight for cattle. This analysis offers an estimated calendar year view comparing the spring to fall seasonal change in price to production and Market Facilitation Program payments for the 2018 crop.
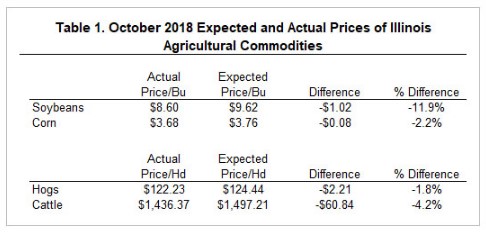
Losses from Lower Prices: Using this methodology, the expected October price for each commodity is higher than the actual October price. The actual October prices relative to the expected October prices for each commodity is shown in the table below. The actual October price fell below the expected October price by less than 5% for corn, hogs, and beef cattle. For soybeans, the actual October price was 11.9% lower than the expected October price, reflecting a much larger relative decline in soybeans than any of the other commodities evaluated.

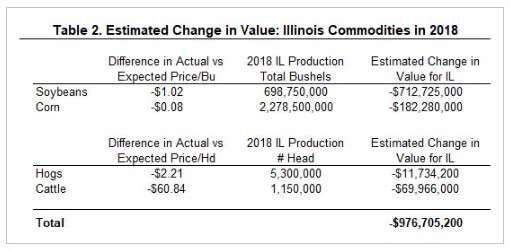
To estimate aggregate impact on Illinois agriculture in 2018, the difference between expected and actual prices is multiplied by 2018 Illinois production for each commodity. For corn and soybeans, Illinois production is the total bushels of grain produced in Illinois for each commodity. For hogs and cattle, Illinois production is the number of head for each livestock type in Illinois in 2018. With these results, we estimate a $712.7 million loss in value for Illinois soybeans in 2018, a $182.3 million loss in value for Illinois corn in 2018, a $11.7 million loss in value for Illinois pork in 2018, and a $70.0 million loss in value for Illinois cattle in 2018. The total loss in value for Illinois agriculture major commodities is $976.7 million.

Market Facilitation Program Payments: The United States Department of Agriculture provided aid to farmers in response to the trade disputes initiated by the U.S. and the retaliatory tariffs from trading partners, especially China. One component of the aid package, the Market Facilitation Program (MFP) provided cash payments to farmers for a subset of commodities, including corn, soybeans, and pork (farmdoc daily,
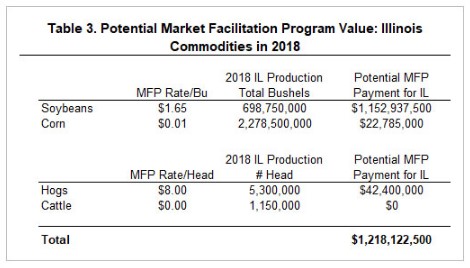
August 28, 2018). Beef, the other Illinois commodity included in this analysis, was not included as an eligible commodity. To receive a payment farmers were required to turn in verifiable and reliable production records and meet other eligibility requirements. While all Illinois farmers may not have turned in production or may not have been otherwise eligible, for consistency in calculations the MFP rates are applied to total Illinois production to approximate the potential value to Illinois agriculture. Using this methodology, Illinois had the potential to obtain $1.2 billion in MFP payments with 95% of the potential value due to soybean payments.

Overall Impact: Revenue losses are projected at -$976.7 million and MFP payments are projected at $1.2 billion, given a net positive impact of $241.4 million within 2018. Although the combined value of Illinois MFP payments offset the combined expected revenue declines within 2018, those payments do not align by commodity and may not match losses at an individual producer level. The results of this analysis indicate that MFP payments offset hogs and soybeans by more than expected losses, while MFP payments for corn were lower than expected losses. Illinois farmers who heavily favored soybeans in their 2018 rotation benefitted while those who heavily favored corn in their 2018 rotation did not recoup losses. Moreover, the impact of the trade conflict on commodity prices is expected to be long lasting. While the MFP payments compensated for 2018 losses in aggregate, only compensating for 2018 losses will not cover losses in 2019 and beyond.
Summary and Outlook
It is estimated that Illinois agriculture experienced a total 5.5% loss in value from expectations for 2018, as represented by analysis on four major Illinois commodities. With the assistance of estimated MFP payments, total losses were offset, resulting in a net estimated gain in value of 1.4%. Although many economic factors influence price, prices were below expected values based on historical price and yield data. As an example, soybeans show clear negative divergence from a normal price pattern, even for a high yielding year, leading to the assumption that the difference is likely due to the trade conflict and retaliatory tariffs.
Soybeans experienced a much larger deviation from expected price than other Illinois commodities and accounted for 73% of the total loss in value for Illinois agriculture. Despite the severe expected loss in value for soybeans, MFP payments more than offset those losses with soybeans receiving 95% of the potential MFP payments. Alternatively, MFP payments did not cover expected loss in value for corn. For Illinois grain farmers with a soybean and corn rotation, this could have been an advantage or detriment depending on the ratio of soybeans and corn on the farm in 2018. Illinois hogs also received a MFP payment that exceeded expected losses, while cattle did not receive any MFP payments despite a deficit between actual value of production and expected value in Illinois. The intent of MFP payments was to compensate farmers who suffered losses in 2018 related to the trade conflict. On the aggregate level, MFP payments sufficiently filled that intent for 2018, but will not cover future losses related to the currently unresolved trade conflict.
As part of the temporary trade truce and ongoing negotiations, China resumed purchases of U.S. agricultural commodities in December 2018. While this was a positive for outlook, farmers entered 2019 with depressed prices, tariffs still in place, and lack of resolution to the trade conflict. Assuming stable production and supply in 2019, higher prices will require restored export markets, an alternative demand replacement, or some other positive economic influence on demand.