The effect of cover crop on crop yields, soil health, and nitrate-nitrogen (N) leaching is complex and variable from year to year. From an environmental point of view, the higher the rye biomass production at termination day, the higher the likelihood of increasing soil organic carbon and decreasing N leaching. However, common asked questions are whether the magnitude of rye biomass is proportionally related to yield benefits or losses and how much water and N does rye use?
To answer these questions, we first synthesized existing knowledge and developed a conceptual diagram to illustrate the mechanisms by which the rye can affect corn yield and nitrate-N leaching, which can serve as a framework for understanding cover crop effects on corn. Then, we synthesized six years of experimental data from the Comparison of Biofuels Systems (COBS) site near Kelly, Iowa (central Iowa); rye literature data from Midwest and APSIM model simulations; and developed robust relationships to support decision making. In this analysis, we considered the following data: crop yields, rye biomass, rye C/N ratio, rye root/shoot ratio, nitrate-N leaching and drainage, soil moisture and temperature, and spring nitrate tests. The results from this work are reported in the study
“Rye cover crop effects on maize: A system-level analysis” recently published in the Field Crops Research Journal by Rafael Martinez-Feria, Ranae Dietzel, Matt Liebman, Matt Helmers, and Sotirios Archontoulis.
Mechanisms by which rye affects corn yields
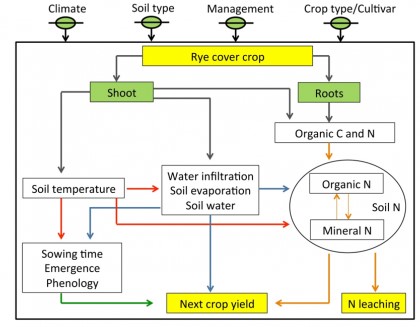
Broadly speaking, the factors that could influence whether rye affects yield and nitrate-N leaching can be grouped into biotic and abiotic factors. Biotic factors include pests and disease pressure and allelopathy, but these are not well understood. In contrast, more data exist for abiotic factors such as water and nitrogen limitations, which allowed us to develop a framework to allow a systems-level understanding of rye effects (Fig. 1). Rye brings into the system root and shoot carbon amounts of certain quality (C/N ratio) that affects soil C and N cycling and influences soil water and temperature. In turn, soil water, temperature, and N affect yield and nitrate-N leaching. If we change the climate, soil type, management, crop type or cultivar, the magnitude of the effects will be different, but the mechanisms will be the same (system-analysis). Because the abiotic factors are related to each other (e.g. soil temperature affects soil moisture, which in turn affects the status of N in the soil; see Fig. 1) it is hard to determine the effect of rye on the corn system by studying factors in isolation. Therefore, in this work we used a high-resolution, multi-year, multi-variable dataset coupled with systems modeling to deeper understand rye effects.

Figure 1. Conceptual diagram showing the abiotic mechanisms by which rye can affect corn yields and nitrate-N leaching. Arrows indicates effects (mechanisms). Boxes are the variables we measured.
Soil temperature effects are minor, suggesting negligible impacts on corn seedling emergence
Our high-resolution temperature measurements (every 30 minutes for five years at multiple soil depths) showed very minor treatment effects despite the range of rye biomass values measured (from 0 to 2,500 lb/acre) and thus soil shading capacities. In the top soil layer, the difference in soil temperature compared to the no-cover crop control was about 1.0 ºF cooler by the time of termination, and there were no differences in soil temperature by the time of corn planting. This indicates that the temperature effect caused by rye on seedling emergence was minimal.
Soil water stress can cause corn yield penalty in drought years via different mechanisms.
Rye water use is of concern during drought years. By using a water balance approach we calculated that 1,000 lb/acre of rye growth uses roughly the equivalent of an 0.8-inch rain (Fig. 2). The relationship provided in Fig. 2 provides a baseline to decide appropriate termination timing during dry conditions. It should be noted that the drought-related mechanisms that can result in a yield penalty can be different depending on the year and the time of drought. In our study, for instance, rye significantly reduced soil moisture throughout the season by an average of 1inch, resulting in a yield penalty in 2012 (assuming that biotic factors had no impact).
Figure 2. Rye shoot biomass versus estimated water use (transpiration) using experimental data from COBS.
Rye roots have greater potential to immobilize N during decomposition than rye shoots.
Field measurements coupled with literature and simulated data suggests that rye shoot biomass decomposition will not immobilize N if it is terminated before 1,400 lb/acre of shoot growth (~25 C/N ratio). Decomposition of roots is more likely to immobilize N than shoots because of their higher C/N ratio.
Rye decreased nitrate-N losses by reducing nitrate-N concentration in drainage rather than drainage volume.
Nitrate-N losses in tile drainage were reduced in two out of the six studied years (2011 and 2012) while no differences were found in drainage water volume in any of the studied years. On the other hand, average flow-weighted nitrate-N concentrations were also reduced during those years indicating that nitrate-N losses were lower because rye growth reduced soil mineral N concentrations rather than drainage water volume.
Rye biomass at termination day is a poor predictor of rye effects on yield, but it is related to nitrate-N leaching mitigation.
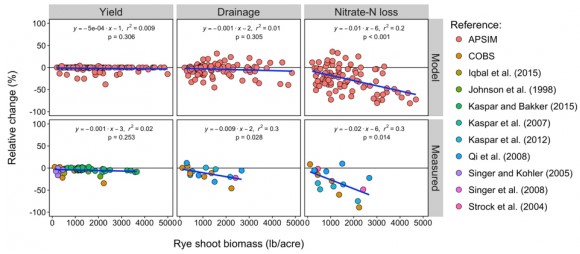
Experimental, literature, and modeling data indicated that rye biomass at termination date is not a good predictor of cover crop effects on corn yields (Fig. 3). This lack of relationship may be because other factors such as water and nitrogen stresses around flowering and grain filling periods. These factors may be more important than small changes in soil water and nitrogen at corn planting. For the nitrate-N leaching losses, we found a significant proportional relationship between rye biomass amount and N leaching reduction for both measured and simulated values. The data variability around this relationship is related to the variability in C/N ratio of the rye biomass at termination. APSIM model scenario analysis using four cover crop termination dates and 35 years of weather variability for central Iowa indicated high year-to-year variability on cover crop effects. On average, rye reduced NO3-N losses by 26% (± 26%), drainage by 4% (± 13%) and crop yields by 2% (±6%). Although not considered in this analysis, yield penalties have been found to sometimes be related to lower crop population densities, which seems to suggest that biotic stresses such as allelopathy and increased disease pressure or other factors may play a role in adverse crop responses.

Figure 3. Measured and simulated cover crop effects on corn yield, annual tile drainage and annual NO3-N losses versus rye biomass production. A negative value indicates that cover crop decreases yield or drainage or leaching. (Click image for larger view)
Summary reflection
Producers using cover crops or planning to do so in the future, need to weigh the long-term benefits of improved soil and environmental quality versus the short-term risks of yield reductions. Unfortunately, we could not find a strong relationship between rye biomass at termination (an easily measurable trait) and yields and nitrate-N leaching, which speaks to the complexity in the corn-rye-soil-atmosphere system (Fig. 1). Whether yield penalties arise will ultimately depend on intricate combinations of environmental conditions and management. In this work we provided useful baselines for quantifying trade-offs and risks associated with cover crop practice to assist decision-making.
This work was funded by the Iowa Nutrient Reduction Center under the project “Quantifying temporal and spatial variability in NO3-N leaching across Iowa”.
Source : iastate.edu