By Carl Zulauf
Department of Agricultural, Environmental and Development Economics
Ohio State University
Gary Schnitkey, Krista Swanson, and Nick Paulson
Department of Agricultural and Consumer Economics
University of Illinois
Different farm program payments across crops have been an on-going US farm policy issue, with the focus often on high per acre payments to cotton, peanuts, and rice. Coppess discusses this issue extensively. An important economic question is, “Have different payments impacted the geographical distribution of US crops?” This study finds that, since the late 1990s, the share of US principal crop acres (see Data Note 1) in states with cotton, peanut, and rice program base acres has declined. While a simple analysis and not the only way to analyze the issue, this finding suggests different program payments across crops has not had a large impact on the geographic distribution of US crops.
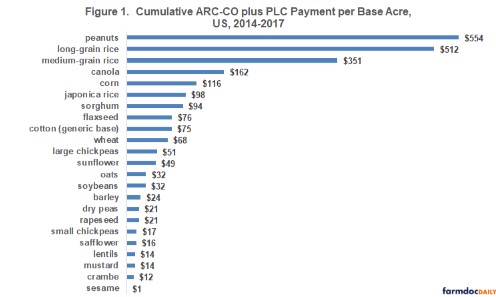
2014 -2017 Payments: Figure 1 illustrates the recent difference in farm program payments across crops, specifically different cumulative payments per base acre for 2014-2017 crops from the 2014 Farm Bill’s ARC-CO and PLC programs (Agriculture Risk Coverage – County; Price Loss Coverage). The range was $1 per base acre summed over all 4 years (sesame) to $554 per base acre summed over all 4 years (peanuts). Payment per base acre is 45 times higher for peanuts than crambe, which has second lowest cumulative payment. The other 4 crops that are the focus of this study (long-grain rice, medium-grain rice, Japonica rice, and cotton rank 2nd, 3rd, 6th and 9th, respectively, out of 23 program commodities. The 2018 crop was also under the 2014 Farm Bill, but was not included since the cotton generic base program was replaced by a new seed cotton program (see Data Note 2).
Share of US Principal Crop Acres: A state’s share of US principal crop acres is compared between two 5-year time periods: 1996-2000 and 2016-2020. The analysis starts with 1996 because, in a major policy shift, the 1996 Farm Bill eliminated annual land set asides. With a few exceptions, farms could plant whatever they desired. They likely chose the most profitable option, including planting no crop.
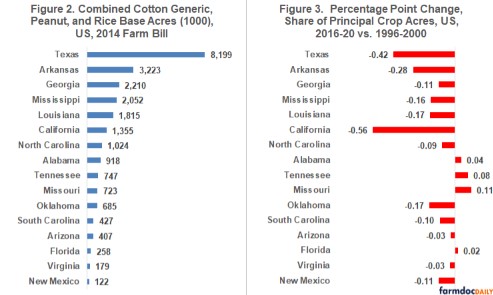
As of the 2014 Farm Bill sign up, 16 states had at least 100,000 total base acres of cotton plus peanuts plus rice (see Figure 2). Seven states had at least 1 million cotton-peanut-rice base acres: Arkansas, California, Georgia, Louisiana, Mississippi, North Carolina, and Texas. In all 7 of these states with the largest cotton-peanut-rice base, share of US principal crop acres declined from 1996-2000 to 2016-2020 (see Figure 3). The declines ranged from -0.56 percentage point (pp) in California to -0.09 pp in North Carolina. For the 7 states together, combined share of US principal crop acres declined from 16.70% in 1996-2000 to 14.91% in 2016-2020, or by -1.79 pp. Combined share of all 16 states declined by -2.0 pp (28.70% to 26.70%). Share of principal crop acres increased in 4 states, with Missouri’s increase the largest at +0.11 pp.
Concluding Observations
Since the late 1990s, the share of US principal crop acres in states with cotton, peanut, and rice base acres have declined as a group as well as for most of these states individually.
This analysis is simple and unconditional. Unconditional analysis means only 1 factor is analyzed, in this case cotton-peanut-rice base acres. Other possible explanatory factors include crop farm profitability, quantity of land that can be converted into cropland; competing land uses such as urban development; and land use policy including conservation programs. Despite being unconditional, this analysis clearly suggests that differential payments across program crops have not likely had a major impact on the state-by-state distribution of US principal crop acres.
The preceding conclusion does not mean that other economic impacts or issues of “fairness” do not exist. To illustrate the latter, a fairness question is, “What should be the appropriate range of payments across program commodities?” A more direct, simple version: “Is a 45 to 1 ratio fair?” Issues of fairness involve a different type of discussion than do issues of economic impact.
A potential explanation for the conclusion reached by this analysis is that principal crop acres are near or at their maximum given available land and current policy. Since 1996, principal crop acres have increased in only 8 states despite the extended prosperity of 2007-2013: Alabama, Kansas, Kentucky, Maryland, Nebraska, North Dakota, South Dakota, and Tennessee. Only North Dakota added more than 500,000 acres (1.7 million) or had a percent increase greater than 4% (8%). A constraint on principal crop acres appears to be a defining feature of contemporary US agriculture.
While a principal crop acre constraint may mitigate some economic impacts of farm program payments, failure of the US to expand crop acres, either via new acres or more double cropping, has underpinned its declining role in world agriculture (see April 15, 2020 farmdoc daily). So far, the US has decided this is not an issue worth discussion. Will it continue to do so?
Data Notes
- Principal crops are barley, canola, chickpeas, corn, cotton, dry edible beans, hay, oats, peanuts, potatoes, proso millet, rice, rye, sorghum, soybeans, sugar beets, sugarcane, sunflower, tobacco, and wheat,. Harvested acres are used for hay, sugarcane, and tobacco in computing total planted area. Acres include double cropped acres and unharvested small grains planted as cover crops.
- Congress did not designate cotton a covered program commodity in the 2014 Farm Bill. Thus, cotton was ineligible for ARC and PLC. This decision was driven by Brazil’s successful World Trade Organization suit against US cotton support programs. Congress however converted cotton base acres into generic base acres and made covered commodities planted on them eligible for ARC and PLC. For the 2018 crop, Congress made cottonseed a covered commodity and eliminated cotton generic base acres.
Source : illinois.edu