By Lisa Elliott
Technical signals can be incorporated into agricultural marketing plans to identify decision points. There are many types of technical signals that can be utilized. Technical signals can be calculated based on historical price and volume data with the aim to forecast prices. These signals can be utilized alone, or coupled with fundamental indicators. The types of technical indicators include: trend, momentum, volume, and volatility. So, does using technical signals generate profits?
Table 1. Predicting or Trend Determining Types of Technical Signals
| | Trend | Momentum | Volume | Volatility |
| Predicting | Parabolic Stop and Reverse (Parabolic SAR) | Stochastic Oscillator Commodity Channel Index (CCI) Relative Strength Index (RSI) | Chaikin Oscillator On-Balance Volume (OBV) Volume Rate of Change | |
| Determining current trend | Moving Averages Moving Average Convergence Divergence (MACD) | | | Bollinger Bands Average True Range Standard Deviation |
The academic research has shown mixed results with few studies examining agricultural commodities, specifically. The bulk of the research on technical performance is based on equity and currency markets. Using technical signals relies on the assumption that prices follow trends, history repeats itself, and that not all market information is incorporated in the market price. Even so, using technical signals to develop rules for selling can help take out some of the emotion out of marketing decisions and provide more confidence in making decisions if a technical indicator has been found to improve performance historically. A producer should utilize technical signals that they are familiar with and understand the basic statistics behind the calculations of the indicators.
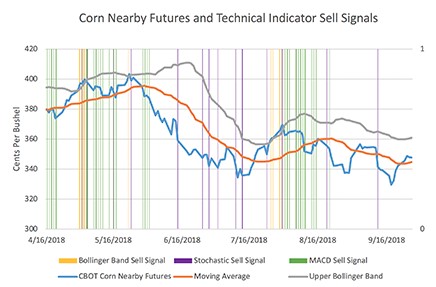
A producer may want to choose multiple indicators from different categories (trend, momentum, volatility, volume) when developing a marketing plan using multiple technical signals. For example, a producer could utilize a trend signal like the MACD, a momentum signal like the stochastic oscillator, and a volatility signal like the Bollinger band to form a selling rule. A simple selling rule could be to sell when all three give a sell signal at the same time. This may reduce the amount of false sell signals and improve performance of using technical to improve your market objectives. Figure 1 shows nearby corn futures with a Bollinger band sells signals (yellow lines), stochastic sell signals (purple lines), and MACD sell signals (purple lines). During the time span in Figure 1, using default settings used for the three signals, there was no time when all three technical signals indicated a time to sell at the same time. However, there were multiple times when two signals triggered at the same time. For example, on May 16, 2018 the stochastic and MACD both triggered sell signals. Another example, a Bollinger band sell signal and stochastic sell signals were both triggered on July 31st, and May 2nd of 2018.

Figure 1. Corn Nearby Futures and Technical Indicator Sell Signals
An example of a technical signal used to make marketing decisions is the Bollinger Band. The middle Bollinger band is made up of a moving day average with some specified number of days to calculate the moving average. Typically, a 20 day Moving average is used. The upper and lower bands are the standard deviations from the middle moving average. One standard deviation plus or minus from the moving average, assuming a normal distribution, contains 66% of the expected prices. Two standard deviations consist of 95%. The number of standard deviations to set your Bollinger Bands can vary, but the typical setting is two standard deviations. The distance between the upper and lower band indicates the level of volatility in the market. When there is greater distance between the upper and lower bands there is greater volatility. While a narrower distance between the upper and lower bands indicates lower volatility. A hedging/selling rule that could be utilized is when the current price closes above the upper Bollinger band, then sell.
Click here to see more...