Overview
Corn, cotton, soybeans, and wheat were up for the week.
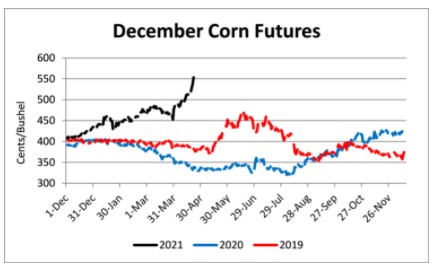
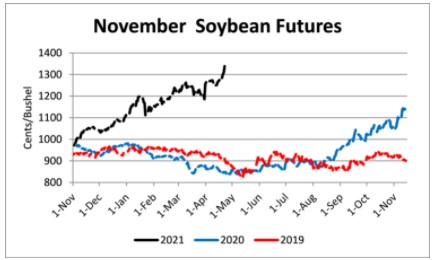
Grain and oilseed prices went vertical this week with new contract highs set for corn, soybeans, and wheat. To say prices have been on a bullish tear would be to understate the recent price advance. On April 1, December corn closed at $4.84 ½, on April 22 the contract closed at $5.53 ¼, a 68 ¾ cent move or +14.2% in 14 trading days! November soybeans had a similar move, closing April 1 at $12.63 ¾ and April 22 at $13.38 ¾, up 75 cents or +5.9%. July wheat moved from $6.10 ½ to $7.10 ½, up 100 cents +16.4%. The sustained rally in grain and oilseed futures and high rates of return have attacked additional investment money. This is evident when looking at the CFTC’s commitment of traders (COT) report. For example, managed money is 397,231 contracts long corn, the largest long position since 400,627 contracts in 2011. The increased interest in grains and oilseeds has pushed prices higher (and may continue to do so), however eventually those positions will need to be exited and this could create a rapid decline. It should be pointed out that this influx of money did not create the bullish price trend, but it has potentially amplified it. Long term price direction will continue to move due to supply and demand factors, but managed money flows have the potential to amplify swings up or down and increase volatility. Producers have the very difficult task of deciding how to manage their price risk and when to pull the trigger and price additional production.
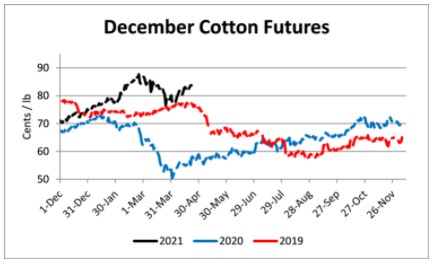
December cotton has quietly reversed the recent down trend and gained 8.41 (75.34 to 83.75) in four weeks. Prices now look poised to return to the 86 cent level and may even run up to 90 cents, if some bullish drought news or continued tightening of domestic stocks or planted acreage is indicated by USDA in future WASDE and Acreage reports.

Corn
Ethanol production for the week ending April 16 was 0.941 million barrels per day, unchanged from the previous week. Ethanol stocks were 20.447 million barrels, down 0.071 million barrels compared to last week. Corn net sales reported by exporters for April 9-15, 2021 were up compared to last week with net sales of 15.3 million bushels for the 2020/21 marketing year and 1.2 million bushels for the 2021/22 marketing year. Exports for the same time period were down 12% from last week at 63.2 million bushels. Corn export sales and commitments were 99% of the USDA estimated total exports for the 2020/21 marketing year (September 1 to August 31) compared to the previous 5-year average of 85%. Across Tennessee, average corn basis (cash price-nearby futures price) strengthened or remained unchanged at West, Mississippi River, North-Central, West-Central, and Northwest elevators and barge points. Overall, basis for the week ranged from 15 over to 36 over, with an average of 26 over the May futures at elevators and barge points. May 2021 corn futures closed at $6.55, up 70 cents since last Friday. For the week, May 2021 corn futures traded between $5.88 and $6.58. May/Jul and May/Dec future spreads were -23 and -105 cents. July 2021 corn futures closed at $6.323, up 59 cents since last Friday.
Corn | May 21 | Change | Dec 21 | Change |
Price | $6.55 | $0.70 | $5.50 | $0.38 |
Support | $6.30 | $0.51 | $5.38 | $0.34 |
Resistance | $6.71 | $0.65 | $5.59 | $0.38 |
20 Day MA | $5.81 | $0.18 | $5.00 | $0.17 |
50 Day MA | $5.60 | $0.08 | $4.82 | $0.08 |
100 Day MA | $5.23 | $0.10 | $4.57 | $0.06 |
4-Week High | $6.58 | $0.57 | $5.57 | $0.40 |
4-Week Low | $5.33 | $0.00 | $4.49 | $0.00 |
Technical Trend | Up | = | Up | = |
Nationally, this week’s Crop Progress report estimated corn planted at 8% compared to 4% last week, 6% last year, and a 5-year average of 8%; and corn emerged at 2% compared to 1% last year and a 5-year average of 1%. In Tennessee, corn planted was estimated at 26% compared to 11% last week, 21% last year, and a 5-year average of 26%; and corn emerged at 5% compared to 3% last year and a 5-year average of 3%. In Tennessee, new crop cash corn prices at elevators and barge points ranged from $5.10 to $5.77. December 2021 corn futures closed at $5.50, up 38 cents since last Friday. Downside price protection could be obtained by purchasing a $5.60 December 2021 Put Option costing 64 cents establishing a $4.96 futures floor.

Soybeans
Net sales reported by exporters were up compared to last week with net sales of 2.4 million bushels for the 2020/21 marketing year and 11.6 million bushels for the 2021/22 marketing year. Exports for the same period were down 45% compared to last week at 8.3 million bushels – a marketing year low. Soybean export sales and commitments were 98% of the USDA estimated total annual exports for the 2020/21 marketing year (September 1 to August 31), compared to the previous 5-year average of 92%. Across Tennessee, average soybean basis strengthened or remained unchanged at West, West-Central, North-Central, Northwest, and Mississippi River elevators and barge points. Basis ranged from even to 27 over the May futures contract. Average basis at the end of the week was 14 over the May futures contract. May 2021 soybean futures closed at $15.39, up 106 cents since last Friday. For the week, May 2021 soybean futures traded between $14.34 and $15.49. May/Jul and May/Nov future spreads were -23 and -198 cents. May 2021 soybean-to-corn price ratio was 2.35 at the end of the week. July 2021 soybean futures closed at $15.16, up 94 cents since last Friday.
Soybeans | May 21 | Change | Nov 21 | Change |
Price | $15.39 | $1.06 | $13.41 | $0.67 |
Support | $15.06 | $0.97 | $13.15 | $0.57 |
Resistance | $15.66 | $1.17 | $13.58 | $0.69 |
20 Day MA | $14.29 | $0.20 | $12.67 | $0.24 |
50 Day MA | $14.16 | $0.13 | $12.40 | $0.16 |
100 Day MA | $13.55 | $0.16 | $11.78 | $0.13 |
4-Week High | $15.49 | $0.93 | $13.46 | $0.61 |
4-Week Low | $13.64 | $0.00 | $11.84 | $0.00 |
Technical Trend | Up | = | Up | = |
Nationally, this week’s Crop Progress report estimated soybeans planted at 3% compared to 2% last year and a 5-year average of 2%. In Tennessee, soybeans planted were estimated at 2% compared to 2% last year and a 5-year average of 1%. In Tennessee, new crop cash soybean prices at elevators and barge points ranged from $12.80 to $13.63. November 2021 soybean futures closed at $13.41, up 67 cents since last Friday. Downside price protection could be achieved by purchasing a $13.60 November 2021 Put Option which would cost 105 cents and set a $12.55 futures floor. Nov/Dec 2021 soybean-to-corn price ratio was 2.44 at the end of the week.

Cotton
Net sales reported by exporters were up compared to last week with net sales of 103,100 bales for the 2020/21 marketing year and 42,800 bales for the 2021/22 marketing year. Exports for the same time period were up 5% compared to last week at 329,000 bales. Upland cotton export sales were 104% of the USDA estimated total annual exports for the 2020/21 marketing year (August 1 to July 31), compared to the previous 5-year average of 101%. Delta upland cotton spot price quotes for April 22 were 83.80 cents/lb (41-4-34) and 86.05 cents/lb (31-3-35). Adjusted world price increased 2.33 cents to 70.49 cents. May 2021 cotton futures closed at 87.51, up 3.8 cents since last Friday. For the week, May 2021 cotton futures traded between 83.12 and 87.73 cents. May/Jul and May/Dec cotton futures spreads were 1.29 cents and -2.58 cents. July 2021 cotton futures closed at 88.8 cents, up 3.77 cents since last Friday.
Cotton | May 21 | Change | Dec 21 | Change |
Price | 87.51 | 3.80 | 84.93 | 2.40 |
Support | 83.48 | 0.86 | 83.00 | 1.56 |
Resistance | 89.74 | 4.10 | 86.32 | 2.20 |
20 Day MA | 81.98 | 0.51 | 81.13 | 0.74 |
50 Day MA | 85.46 | -0.10 | 82.85 | 0.16 |
100 Day MA | 82.35 | 0.55 | 79.26 | 0.63 |
4-Week High | 87.73 | 0.19 | 85.36 | 0.86 |
4-Week Low | 77.12 | 0.00 | 75.34 | 0.00 |
Technical Trend | Up | = | Up | = |
Nationally, this week’s Crop Progress report estimated cotton planted at 11% compared to 8% last week, 11% last year, and a 5-year average of 9%. December 2021 cotton futures closed at 84.93 cents, up 2.4 cents since last Friday. Downside price protection could be obtained by purchasing an 85 cent December 2021 Put Option costing 6.93 cents establishing a 78.07 cent futures floor.

Wheat
Wheat net sales reported by exporters were up compared to last week with net sales of 8.8 million bushels for the 2020/21 marketing year and net sales of 13.7 million bushels for the 2021/22 marketing year. Exports for the same time period were up 20% from last week at 20.6 million bushels. Wheat export sales were 96% of the USDA estimated total annual exports for the 2020/21 marketing year (June 1 to May 31), compared to the previous 5-year average of 103%. In Tennessee, spot wheat prices ranged from $6.87 to $7.45. May 2021 wheat futures closed at $7.10, up 58 cents since last Friday. May 2021 wheat futures traded between $6.50 and $7.14 this week. May wheat-to-corn price ratio was 1.08. May/Jul and May/Sep future spreads were 2 and 2 cents.
Wheat | May 21 | Change | Jul 21 | Change |
Price | $7.10 | $0.58 | $7.12 | $0.57 |
Support | $6.94 | $0.52 | $6.95 | $0.52 |
Resistance | $7.22 | $0.57 | $7.23 | $0.57 |
20 Day MA | $6.39 | $0.14 | $6.40 | $0.17 |
50 Day MA | $6.45 | $0.03 | $6.39 | $0.05 |
100 Day MA | $6.38 | $0.04 | $6.30 | $0.04 |
4-Week High | $7.14 | $0.55 | $7.15 | $0.55 |
4-Week Low | $5.93 | $0.00 | $5.92 | $0.00 |
Technical Trend | Up | = | Up | = |
Nationally, the Crop Progress report estimated winter wheat condition at 53% good-to-excellent and 17% poor to very poor; winter wheat headed at 10% compared to 5% last week, 13% last year, and a 5-year average of 14%; and spring wheat planted at 19% compared to 11% last week, compared to 7% last year, and a 5-year average of 12%. In Tennessee, winter wheat condition was estimated at 75% good-to-excellent and 3% poor to very poor; winter wheat headed at 10% compared to 4% last week, 23% last year, and a 5-year average of 18%; and winter wheat jointing at 79% compared to 66% last week, 85% last year, and a 5-year average of 83%. In Tennessee, new crop wheat cash contracts ranged from $6.42 to $7.35. July 2021 wheat futures closed at $7.12, up 57 cents since last Friday. Downside price protection could be obtained by purchasing a $7.15 July 2021 Put Option costing 46 cents establishing a $6.69 futures floor. September 2021 wheat futures closed at $7.12, up 56 cents since last Friday.
Source : tennessee.edu