By Gary Schnitkey and Jim Baltz et.al
Department of Agricultural and Consumer Economics
University of Illinois
Carl Zulauf
Department of Agricultural, Environmental and Development Economics
Ohio State University
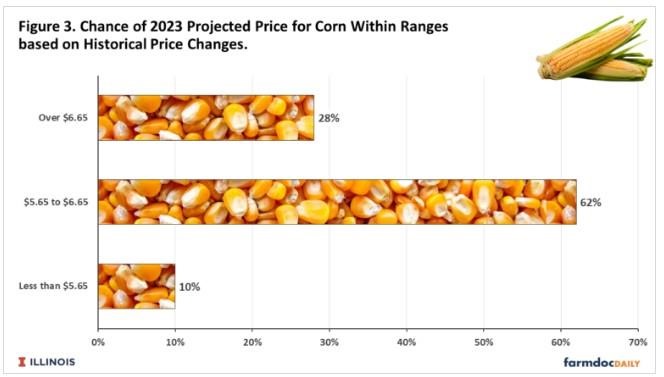
Current futures prices signal relatively high prices for corn and soybeans in the fall of 2023. Relatively high prices are needed to have profitability given significant increases in costs for 2023 (farmdoc daily, August 2, 2022). Any price declines could result in negative profit margins, particularly until projected prices for crop insurance products are set in February based on settlement prices of the November (soybeans) and December (corn) 2023 Chicago Mercantile Exchange (CME) futures contracts. Once projected prices are set, a floor under revenue can be established using revenue insurance. Herein, we look at possible price changes based on history. Historical changes in prices suggest a 10% chance of having a projected price below $5.65 for corn and a 24% chance of a projected price below $13 for soybeans.
Corn
Our analysis for corn is based on prices of the December CME futures contract; the same contract used to set the projected price and harvest price for crop insurance purposes. As shown in Figure 1, three sets of prices are used:
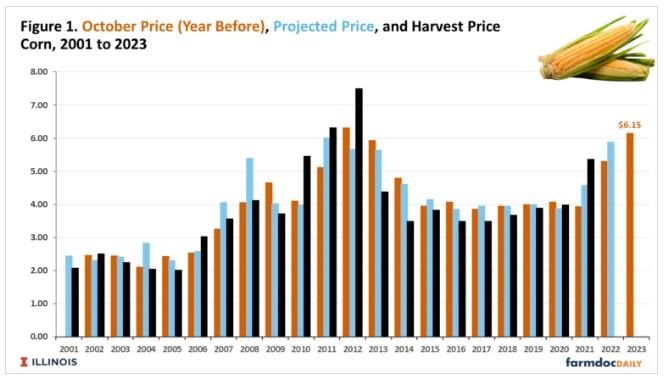
- October price is the average of the settlement prices during October of the year before the contract expires. For example, the October bar for 2002 in Figure 1 is the average of the December 2002 CME contract during October 2001. Futures markets for grains are largely efficient, meaning that the current price of the December 2023 contract is an excellent indicator of the price in December near the contract’s expiration. For example, during the first week of October, the December 2023 contract is trading at $6.15 per bushel. Based on this price, an expectation of $6.15 for the 2023 projected price is reasonable. If the period between now and February 2023 could be repeated many times, the average 2023 projected prices would be near $6.15. Of course, as illustrated below, the actual price can vary from this projection in any year.
- Projected price is the average of the settlement prices of the December contract during February. This price is used for setting guarantees for Revenue Protection (RP), RP with harvest price exclusion, Area Risk Protection (ARP), and ARP with harvest price exclusion. It also determines payments on yield losses from Yield Protection (YP) and Area Yield Plan (AYP). Supplemental area plans– Supplemental Coverage Option (SCO) and Enhanced Coverage Option (ECO) – also use the February price. For 2022, the projected price is $5.90 per bushel.
- Harvest price is the average of the settlement prices of the December contract during the month of October of the year the contract expires. The harvest price is used to determine insurance guarantees.
Several relationships can be seen in Figure 1. First, there is a correlation between October, projected, and harvest prices. When the October price starts high, the projected and harvest prices also tend to be high, and vice versa. Overall, the October and projected prices have a .90 correlation, and the October and harvest prices have a .80 correlation coefficient.
While correlated, there is variability between the three sets of prices. The projected price can be above and below the October price. Large increases occurred in 2004 (3%), 2007 (24%), and 2008 (33%). The years 2007 and 2008 were associated with the ethanol build, and the likelihood of a similar event occurring may not be high. Two years of significant declines were 2009 and 2012. In 2009, the October price was $4.67, while the projected price decreased by 13% to $4.04. In 2012, the October price was $6.32 per bushel, while the projected price was 10% lower at $5.68 per bushel.
A complete list of price changes between the October and projected prices is shown in Figure 2. During this time, the projected price was above the October price about the same number of times as it was below the October price.
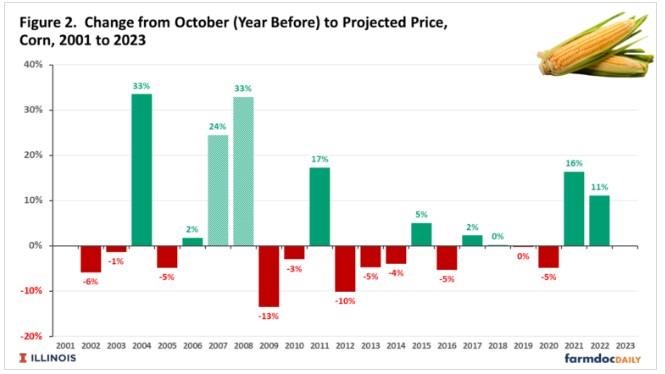
The price changes in Figure 2 were used to construct a histogram of likely 2023 projected prices given a $6.15 current price. The $6.15 price was adjusted by the price changes in Figure 2, and a histogram of the potential projected price was calculated. We calculated that there was a 10% historical chance of being below $5.65, or $.50 per bushel lower than the current $6.15 price (see Figure 3). There is a 28% chance of being above $6.65 per bushel, or $.50 above the current price. The largest probability, a 62% chance, is in the 2023 projected price being within the $1.00 range extending from $0.50 above to $0.50 below the current price for fall 2023.
Soybeans
A similar analysis was conducted for soybeans, with November CME contracts used to conduct the analysis. The November contract is used to set projected and harvest prices for crop insurance purchases. The October and projected prices have a .92 correlation coefficient. The October and harvest prices have a .81 correlation coefficient. Like corn, there is a high degree of correlation between the prices, particularly the October and projected prices. The November 2012 contract price during the first week of October 2022 is trading around $13.45 per bushel.
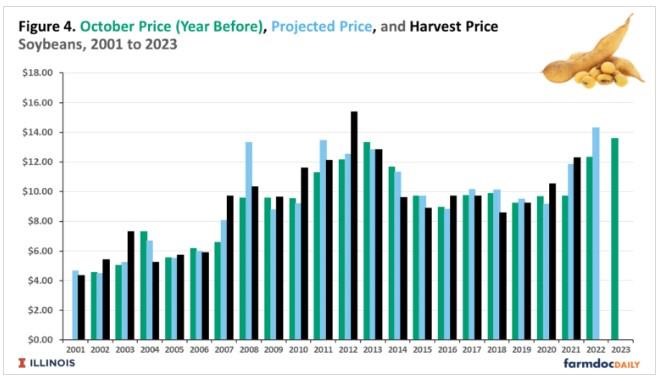
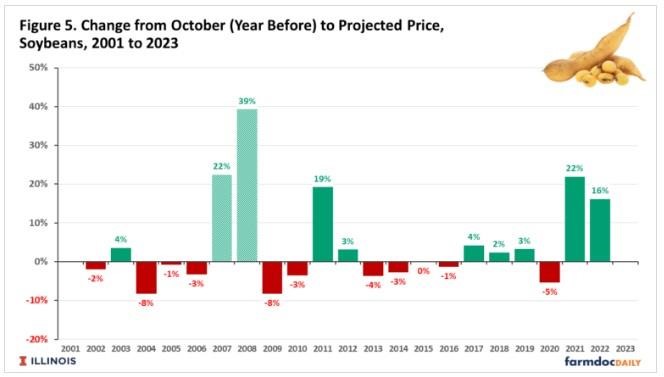
Figure 5 shows price changes between October and projected prices. Large increases occurred in 2007, 2008, 2011, 2021, and 2022. Like corn, the 2007 and 2008 price increases were heavily influence by the ethanol build, and similar occurrences may not occur for the foreseeable future. Large negative deviations occurred in 2004 and 2009.
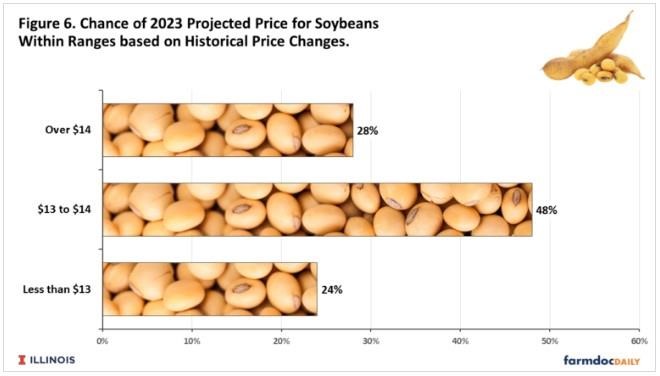
The histogram of possible projected prices is shown in Figure 6. History suggests a 24% chance of a projected price of soybeans being less than $13 per bushel. There is a 28% chance of being above $14 per bushel. As with corn, the greatest probability is a price near the current price for fall 2023. There’s a 48% change of a price between $13 and $14.
Concluding Thoughts
Once projected prices are set, farmers can establish floors under revenue using crop insurance products. Prices on current 2023 CME contracts point to relatively high projected prices, and expectations will center around $6.15 per bushel for corn and $13.45 per bushel for soybeans. Still, historical price changes suggest that there are significant possibilities for lower projected prices. Lower price projections could occur because of a combination of the following factors:
- Brazil has a good planting season, plants a large crop, and prospects are for a good growing season.
- The Ukraine-Russia conflict becomes more settled, leading to more reliable supply from the Ukraine and Russia.
- The world economy heads into a recession, leading to a reduction in demand for agricultural goods.
If a farmer is concerned about these risks of lower prices, pricing or hedging some of 2023 production would be a prudent practice, particularly as input decisions are made. Current input prices will result in much higher costs on most farms.
Higher prices are possible, likely due to the combination of the above factors:
- The Ukraine-Russia conflict leads to further constrictions in supply.
- Brazil has a poor growing season.
The above analysis is based on historical probabilities. Using history in this matter assumes that today’s risks are similar to those of recent history. One could argue that risks may be higher with the Ukraine-Russian conflict continuing. Moreover, financial markets have faced turbulent times. In any case, farm-level risks will be reduced once projected prices are set at the end of February.
Source : illinois.edu