By Ignacio Ciampitti
Many producers like to estimate the yield potential of their soybeans well before reaching the end of the season. In contrast with corn, soybeans can easily compensate for abiotic (e.g., temperature, water) or biotic stresses (e.g., insects, diseases). The final number of pods is not determined near the end of the season (beginning of seed filling, R5 stage). For comparison, in corn, the final kernel number is attained during the 2-week period after flowering. Thus, when estimating soybean yield potential, we have to keep in mind that the estimate could change depending on the growth stage at the time the estimate is made and weather conditions. For example, wet periods toward the end of the reproductive period can extend the seed-set period, promoting greater pod production and retention, with larger seed size and heavier seed weight.
From a physiological perspective, the main yield driving forces are: 1) plants per acre, 2) pods per area, 3) seeds per pod, and 4) seed size. Estimating final yield in soybean before harvest can be a very tedious task, but a simplified method can be used for just a basic yield estimate.
When can I start making soybean yield estimates?
There is not a precise time, but as the crop approaches the end of the season (R6, full seed or R7, beginning of maturity) the yield estimate will be more accurate. Still, you can start making soybean yield estimates as soon as the end of the R4 stage, full pod (pods are ¾-inch long on one of the top four nodes), or at the onset of the R5 stage, beginning seed (seeds are 1/8-inch long on one of the top four nodes). Keep in mind that yield prediction is less precise at those early stages.
Is plant variability within the field an issue in soybeans?
Variability between plants relative to the final number of pods and seed size needs to be considered when trying to get an estimation of soybean yields. In addition, variability between areas within the same field needs also to be properly accounted for (e.g. low vs. high areas in the field). Make yield estimations in different areas of the field, at least 6 to 12 different areas. It is important to properly recognize and identify the variation within the field, and then take enough samples from the different areas to fairly represent the entire field. Within each sample section, take consecutive plants within the row to have a good representation.
Conventional approach to estimating soybean yields
In the conventional approach, soybean yield estimates are based on the following components:
Total number of pods per acre [number of plants per acre x pods per plant] (1)
Total number of seeds per pod (2)
Number of seeds per pound (3)
Total pounds per bushel, or test weight, which for soybeans is 60 lbs/bu (4)
The final equation for the estimation of the potential soybean yield is:
[(1) x (2) / (3)] / (4) = Soybean yield in bushels/acre
Simplified approach to estimating soybean yields
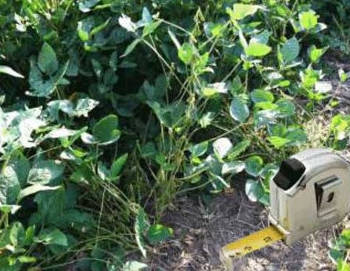
The main difference between the “conventional” and “simplified” approaches is that the conventional approach uses the total number of plants per acre in its calculation; while in the simplified approach, a constant row length is utilized to represent 1/10,000th area of an acre (Figure 1).
For the simplified approach, sample 21 inches of row length in a single row if the soybean plants are spaced in 30-inch rows; in 2 rows if the row spacing is 15 inches; and in 4 rows if the row spacing is 7.5 inches.

Figure 1. In the “simplified” approach to estimating yields, sample 21 inches of row length to equal 1/10,000th of an acre. The number of rows to sample will depend on the row spacing. With 30-inch row spacing, sample one row. With 15-inch row spacing, sample two rows. With 7.5-inch row spacing, sample four rows.
Repeat this procedure in different sections of the field to properly account for the natural field variability.
What are the driving forces of soybean yield?
1) Total number of pods per acre:
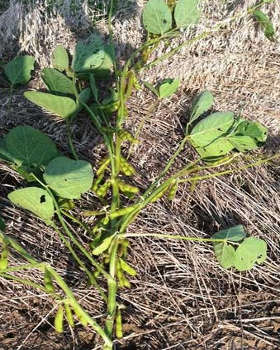
Count the total number of pods (Figure 2) within this constant row length. After counting all the plants within the 21-inch row sections that represent 1/10,000th of an acre, estimate a final pod number per acre. Use a similar procedure in different areas of the field to get a good overall estimate at the field scale. One good criterion is only to consider pod sizes that are larger than ¾ or 1 inch long. Smaller pods can be aborted from this time on in the growing season until harvest.

Figure 2. Total number of pods per plant (only consider the pod sizes larger than ¾ or 1 inch).
2) Total number of seeds per pod:
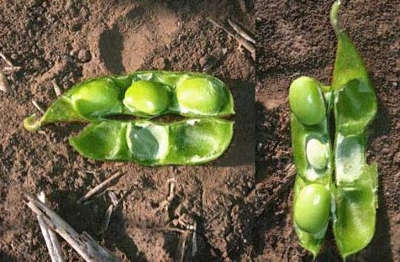
Soybean plants will have, on average, 2.5 seeds per pod (ranging from 1 to 4 seeds per pod), primarily regulated by the interaction between the environment and the genotypes (Figure 3). Under severe drought and heat stress, a pessimistic approach would be to consider an average of 1-1.5 seeds per pod. This value is just an approximation of the final number of seeds per pod, and can change from the time of estimation until the end of the growing season.

Figure 3. The number of seeds per pod will vary somewhat, depending on the growing environment and genotype.
3) Seed size:
Seed size can range from 2,500 (normal to large seed weight) to 3,500 (small seed size) seeds per pound. This season, conditions are mostly favorable in Kansas for promoting large seed sizes. In more stressful years, such as 2012 and 2011, seed size is normally smaller, meaning a larger number for the seeds per pound (e.g. 3,500 seeds per pound). In the simplified estimation approach published by Dr. Casteel, you do not need to actually measure the number of seeds per pound in order to estimate yields, as is done in the conventional approach. Instead, a seed size conversion factor is used. If the conditions are favorable and large seed size is expected, the conversion is 15 units; while if abiotic or biotic stresses are present during the seed-filling period, a seed size factor of 21 units is used. Further details related to the seed size factor can be found in the link to the Purdue University extension article listed at the end of this article.
Example of the simplified approach for estimating soybean yields:
Say that we have 120,000 plants/acre in a 30-inch row. Then, we should have around 12 plants in 21 inches of row. In those 12 plants, we have measured on average 22 pods per plant, with a total number of 264 pods (22 x 12).
If we assume a “normal” growing season condition, then the final seeds per pod will be around 2.5, and for the seed size factor, we can assume large seeds, and will use a conversion factor of 15 units.
Equation for a “Favorable” Season:
264 pods x 2.5 seeds per pod / 15 = 44 bushels per acre
For a “droughty” (late reproductive, from R2 to R6 stages) growing season, the final seed number and size will be dramatically affected. Thus, even if the pod number is the same as in a normal season, the yield calculation could be:
Equation for a “Drought” or Short Seed Filling Season:
264 pods x 1.5 seeds per pod / 21 = 19 bushels per acre
Basically, this “simplified approach” relates the total number of pods in a “known” unit area (easily extrapolated to the acre unit), and is affected by the total number of seeds in the pod. This is adjusted by the estimated seed weight, which is affected by two main components: duration of seed fill and rate of dry mass allocation to the seeds.
Source: ksu.edu