By Gary Schnitkey and Krista Swanson et.al
Department of Agricultural and Consumer Economics
University of Illinois
By Carl Zulauf
Department of Agricultural, Environmental and Development Economics
Ohio State University
We developed a statistical model that projects the 2020 harvest price for corn, given a national corn yield and average of May futures prices. The harvest price is used in crop insurance. The current U.S. yield estimate from the U.S. Department of Agriculture (USDA) is 178.5 bushels per acre. Given this yield estimate and average of actual May futures prices, the harvest price is projected to be $3.10 per bushel. The $3.10 is a future price, and cash prices usually would be lower. A $3.10 harvest price would suggest cash prices below $3.00 this fall. The yield estimate will become more accurate as the growing season progresses, particularly after July when critical growth and pollination normally occur. Higher yields would be expected to result in lower prices and lower yields would be expected to result in higher prices. Still, it seems reasonable to expect harvest prices in the low $3.00 range.
Expected Harvest Prices for Different U.S. Yields
The statistical model used to predict harvest prices is based on two factors:
- Average of settlement prices of the December contract for corn on the Chicago Mercantile Exchange (CME) throughout the month of May. The harvest price is based on the average of settlement prices for the same December contract throughout the month of October. Using settlement prices in May provides unbiased estimates of harvest prices. Although the projected price for crop insurance is set using the average of February settlement prices for the same contract, the use of the May futures contract allows incorporation of a decrease in prices that have occurred after COVID-19 measures have been introduced.
- S. corn yield relative to trend yield. Corn yields are estimates at this point in time, and weather in July will have a large impact on actual yields. Historical relationships indicate that higher corn yields will have a negative impact on prices. The U.S. corn yield is regularly forecast in the World Agricultural Supply and Demand Estimate (WASDE) report produced by the Office of Chief Economist, U.S. Department of Agriculture. As WASDE reports are released, estimates of harvest prices can be revised.
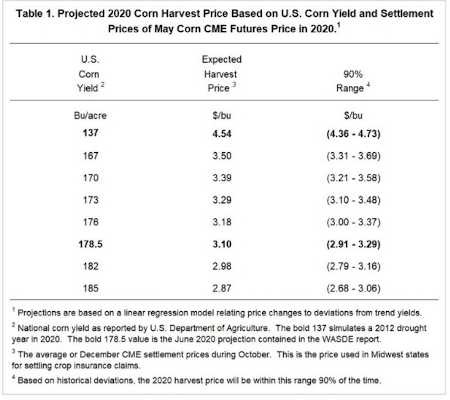
Table 1 shows harvest price projections for different U.S. corn yields. The June WASDE report has a yield estimate of 178.5 bushels per acre. At that yield, the expected harvest price is estimated at $3.10 per bushel (see Table 1). In this case, the harvest price is the expected average of settlement prices in the month of October for the December corn contract traded on the CME. The harvest price is used to calculate crop insurance indemnity payments on corn in the Midwest states. A $3.10 harvest price would be 80% of the $3.88 projected price for 2020. If actual yield equals the guarantee yield to set crop insurance guarantees, 85% revenue insurance policies will make indemnity payments. In Illinois, cash prices in October are usually lower than the harvest price. A $3.10 harvest price suggests cash prices below $3.00 per bushel.

Actual harvest prices can vary from the expected $3.10 harvest price. The statistical model suggests that 90% of the time the harvest price will be in a range from $2.91 per bushel to $3.29 per bushel (see Table 1). In a relative sense, this range is fairly small. All prices in this range are below the actual $3.88 projected price set during the month of February 2020, and overall all prices in this range would be viewed as low prices.
Higher yields will result in lower expected harvest prices. A 167 U.S. corn yield has an expected harvest price of $3.50 per bushel, a 170 bushel yield would suggest $3.39 harvest price, and so on (see Table 1). Table 1 shows a range of U.S. corn yields from 167 to 185 bushels per acre. Given fairly normal weather, U.S. corn yield likely will be within the 167 to 185 range. That yield range results in expected harvest price between $3.50 per bushel and $2.87 per bushel.
Table 1 also includes a $4.54 expected harvest price estimate for a U.S. corn yield of 137 bushels per acre. The 137 bushel yield is equivalent to having a 2012 drought occur in 2020. This event is extremely unlikely, particularly given the weather that has already transpired this year. Still, there is a possibility of adverse weather in 2020.
U.S. Corn Yields and Trend Yields
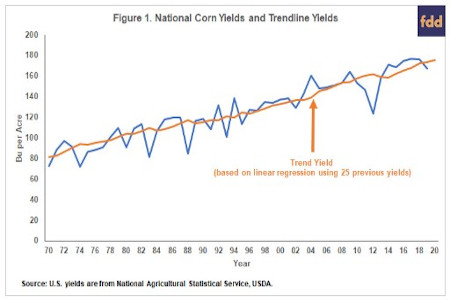
The statistical model was fit using yield data from 1985 to 2019. For each year from 1985 to 2019, a trend yield was calculated based on a linear regression of data from the previous 25 years. For example, the 2019 trend yield was estimated using yields from 1994 to 2018. In 2019, the trend yield was 173.4 bushels per acre. The actual 2019 yield was 167.4 bushel per acre, meaning that the actual yield was 6.0 bushels per acre below trend. Note that trend yields will not vary in a straight line over time because the sample used to estimate the trend yield is changing (see Figure 1).

Historically, more years are above the trend than below the trend (see Figure 1). From 1985 to 2019, actual yields were above trend in 68% of the years. In below trend years, however, the actual yield often is well below trend. Drought years stand out. Actual yield was below the trend yield by 32 bushels per acre in 1988 and 38 bushels per acre in 2012.
The 2020 trend yield from the statistical model is 175.8 bushels per acre. The June WASDE estimate is 2.8 bushels above the trend at 178.5 bushels per acre. Given that actual yields usually are above trend yields, the WASDE estimate of 178.5 bushels per acre seems reasonable.
Deviations from May Settlement Prices and Harvest Prices
The average settlement prices of the December CME contract during the month of May were calculated for each year from 1985 to 2019. This May average will condition each year’s estimate of harvest price based on events that have occurred so far through the marketing year. The year 2020 has been a momentous year with the events surrounding the Coronavirus.
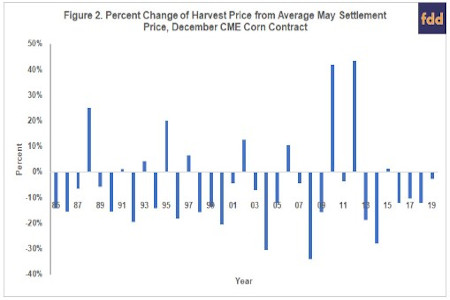
Percent changes were calculated between the harvest price and the average May settlement prices. Take 2019 as an example when the May average was $4.01 per bushel, and the harvest price was $3.90 per bushel. The deviation during this year was -3% ($3.90 harvest price / $4.01 May average – 1).
Figure 2 shows the percent deviations from 1985 to 2019. These deviations have the opposite skew as yields. More of the price deviations are negative. From 1985 to 2019, 71% of the harvest prices were below May average settlement prices. When they occur, positive deviations are large. The 1988 and 2012 drought years again stand out. Price deviations were 33% in 1988 and 32% in 2012.

The average of settlement prices in May 2020 was $3.35 per bushel. This $3.35 is used in making the projections for 2020 harvest price based on the statistical relationship described in the next section.
Relationship Between Price Changes Given Actual Yield Differences Between Trend Yields
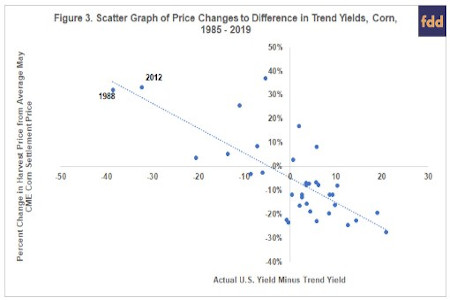
A linear relationship was fit in which the percent changes from the average settlement price in May to the average settlement price in October (harvest price) for the December corn contract were explained by the deviation from trend yield (actual yield minus trend yield). There is a strong relationship between price and yield deviations (see Figure 3). The price changes and yield deviations have a -.75 correlation coefficient. As is expected, price changes tend to be positive when actual yield is below the trend yield. Two of the largest price changes occurred in the 1988 and 2012 drought years, as indicated in Figure 3.

Summary
Given current yield estimates, a statistical model suggests that the harvest price for crop insurance in Midwest states will be near $3.10 per bushel. Higher yields, above current estimates, would be expected to result in lower prices and vice versa. Thus, higher prices could happen if 2020 yields are lower than the trend. Conversely, an above trend yield would likely result in lower prices. A harvest price below $3.00 per bushel is a distinct possibility with above trend yields.
Source : illinois.edu