By Michael Langemeier
Center for Commercial Agriculture
Purdue University
Corn price futures for the July 2021 contract (December 2021 contract) increased from $4.68 per bushel ($4.31 per bushel) in early January to $6.93 ($5.83) for the week ending May 14. Moreover, using the iFarm Price Distribution Tool there was a 29.5 percent chance on May 17 that the expiration price for the December corn futures contract will fall be below $4.50 and a 28.9 percent chance that the price will be above $6.00. Given that the U.S. stocks to use ratio is currently only 8.5 percent and continued questions related to U.S. corn acreage in 2021, there is tremendous uncertainty regarding corn prices for the rest of this year.
A recent article (farmdoc daily March 7, 2019) examined the impact of relatively high corn prices on feeding cost of gain. This article will examine the impact of higher corn prices on cattle finishing net returns. The two primary factors impacting net returns are the feeding cost of gain and the feeder to fed cattle price ratio.
Feeding Cost of Gain
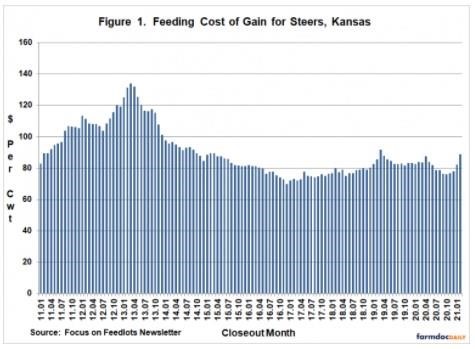
Feeding cost of gain is sensitive to changes in feed conversions, corn prices, and alfalfa prices. Information on these items are available from monthly issues of the Focus on Feedlots newsletter. Figure 1 illustrates feeding cost of gain from January 2011 to February 2021. Using regression analysis, each 0.10 increase in feed conversion increases feeding cost of gain by $1.20 per cwt., each $0.10 per bushel increase in corn prices increases feeding cost of gain by $0.88 per cwt., and each $5 per ton increase in alfalfa prices increases feeding cost of gain by $0.45 per cwt. Using corn projections and seasonal average feed conversions, feeding cost of gain is expected to average $95 in the second quarter, and from $98 to $100 in the third and fourth quarters of 2021. In contrast, feeding cost of gain was $82.30 in January and $88.60 in February.

Feeder to Fed Price Ratio
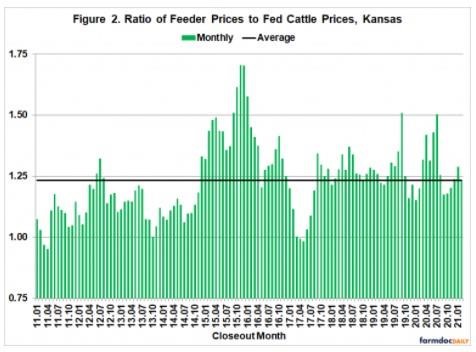
Figure 2 illustrates the ratio of feeder prices to fed cattle prices from January 2011 to February 2021. Feeder cattle and fed cattle prices were obtained from the Livestock Marketing Information Center. The average ratio over this period was 1.232. The feeder to fed cattle price ratio was one standard deviation below (above) this average for 18 (17) months during the ten-year period. The average net return for the months in which the ratio was below one standard deviation of the average was $122 per head. In contrast, the average loss for the months in which the ratio was above one standard deviation was $265 per head.

As cattle feeders well know, if cattle are not purchased at the “right price”, losses will incur. Given the uncertainty in fed cattle prices, this is easier said than done. The strong correlation coefficient between cattle finishing net returns and the feeder to fed cattle price ratio almost guarantees that losses will occur when this ratio is relatively high. Feeder to fed cattle prices are expected to range from 1.15 to 1.17 in the second quarter. For the last six months of this year, feeder to fed cattle prices are expected to range from 1.15 to 1.20 with the lower ratios occurring in the fourth quarter.
Cattle Finishing Net Returns
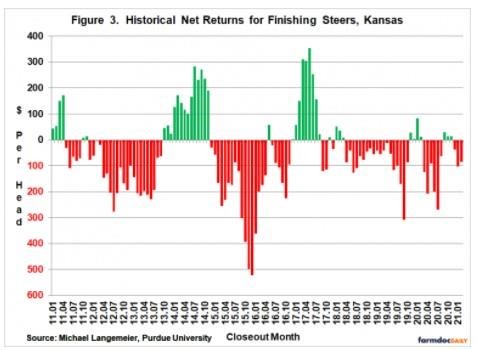
Monthly cattle finishing net returns from January 2011 to February 2021 are illustrated in Figure 3. It is important to note that net returns were computed using closeout months rather than placement months. Several data sources were used to compute net returns. Average daily gain, feed conversion, days on feed, in weight, out weight, and feeding cost of gain were obtained from the Focus on Feedlots newsletter, feeder cattle and fed cattle prices from the Livestock Marketing Information Center, and interest rates from the Federal Reserve Bank of Kansas City.

After a profitable run during the fourth quarter in 2020, net returns have headed southward. Average losses were between $80 and $100 in the first two months of 2021. Losses are expected to continue for much of the rest of this year, but due to volatile corn prices are very uncertain. Given the uncertainty in feeding cost of gain and the feeder to fed cattle price, it is important to gauge the sensitivity of net returns to changes in the feeding cost of gain and the feeder to fed cattle price. Regression analysis was used to examine the relationship between these variables. Results are as follows: each $1 increase in feeding cost of gain results in a decrease in cattle finishing net returns of $5.56 per head, and each 1 percent increase in the feeder to fed cattle price ratio results in a decrease of $10.25 per head in cattle finishing net returns. Using relationships between corn prices, feeding cost of gain, and cattle finishing net returns; the large increase in corn prices since the first of this year, holding all else constant, is expected to reduce cattle finishing net returns by approximately $90 per head in the third and fourth quarters of 2021.
Summary and Conclusions
This article examined the impact of lower corn prices on cattle finishing net returns. Each $0.10 increase in corn price results in an increase in feeding cost of gain of approximately $0.88. In turn, each $1 increase in feeding cost of gain results in a $5.56 per head increase in cattle finishing net returns. Using these values, holding all else constant, the increase in corn prices since earlier this year is expected to result in a $90 reduction in cattle finishing net returns in the second half of this year. It is important note, however, that higher corn prices may also reduce feeder prices, which would dampen the impact of higher corn prices on cattle finishing net returns. Regardless, higher corn prices have substantially weakened potential net return prospects.
Source : illinois.edu