Texas experienced one of its worst droughts ever. The dry, parched conditions caused over $7 billion in crop and livestock losses, sparked wildfires, pushed power grids to the limit, and reduced reservoirs to dangerously low levels.
And according to a recent study led by geoscientists at The University of Texas at Austin, the drought was worse than previously thought.
The study, published in the Journal of Hydrology, incorporated additional soil moisture-related data from gravity and microwave sensors on satellites into a land surface model used by scientists to determine the severity of droughts. According to the updated model simulation, severe drought was more widespread and longer lasting than judged by the U.S. Drought Monitor (USDM), which is the current standard for designating drought across the United States.
“The development of technology has allowed us to gain more real-time observation, and this observation can more accurately reflect the ground conditions,” said Weijing Chen, the study’s lead author and a postdoctoral researcher at the UT Jackson School of Geosciences.
Even though the 2011 drought is now a decade gone, the study results are important because they show that incorporating new sources of data related to soil moisture into an existing land surface model can more accurately predict the severity and impact of droughts.
Soil moisture is a key indicator of drought and one of the most important factors when it comes to a drought’s impact on agricultural production.
The USDM incorporates a number of indexes, expertise and data sources to make its findings, including a hydrological model that gives an estimate of an area’s soil moisture. The UT researchers took their model a step further by using data assimilation technology to incorporate a combination of real-time satellite measurements related to soil moisture into their model. The microwave satellite data gave measurements of the top 2 inches of soil moisture. Adding in the gravity satellite data gave them soil moisture measurements in the rest of the root zone – down to about 40 inches.
“Soil moisture in the root zone is very important because it determines the water supply for vegetation,” Chen said.
The USDM releases a map every week that shows what parts of the U.S. are in drought. It is produced by the National Drought Mitigation Center at the University of Nebraska-Lincoln, the National Oceanic and Atmospheric Administration and the U.S. Department of Agriculture. Its results are used to trigger disaster declarations and other federal, state and local responses.

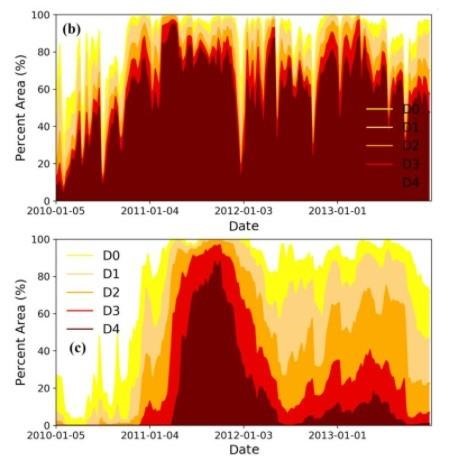
This graphic reflects drought area and severity in Texas from 2010 to 2013. The bottom graph shows the findings of the U.S. Drought Monitor, the current standard for designating drought across the United States. The top graphic reflects the findings of an updated model that incorporated additional soil moisture-related data from satellites. The updated model simulation showed that more areas in Texas were experiencing severe drought longer than previously thought. D0-D4 are drought levels that grow in severity as the number increases. Credit: University of Texas Jackson School of Geosciences.
Chen and her team incorporated the satellite data into an existing land surface model used by researchers around the world. They then zeroed in on what that meant for Texas drought from 2010 to 2013.
The updated model simulation and the USDM were in agreement when it came to the geographical extent of the drought. But the updated model simulation showed that more areas were experiencing more severe drought than determined by the USDM, particularly in the western half of the state. The new model also found that widespread drought started in 2010, much earlier than the USDM.
The results also differ in what was the worst week of the historic drought. For the USDM it was the week of Oct. 4, 2011, with the most severe category of drought gripping 87.99% of the state. For the new model, it was the week of April 5, 2011, with 95.1% of the state experiencing the most severe category of drought.
The researchers said that developing methods for better understanding droughts is important to Texas as policymakers try to determine how the state’s water resources will be affected by climate change and population growth.
“Using measurement from space is a clever way to be able to more realistically detect and monitor droughts,” said co-author Zong-Liang Yang, a professor at the Jackson School.
The study was also co-authored by Chunlin Huang of the Chinese Academy of Sciences. The research was funded by the Chinese Academy of Sciences and the UT Austin-Portugal MAGAL Constellation Project.
Source : utexas.edu