By Juo-Han Tsay and Nick Paulson
Department of Agricultural and Consumer Economics
University of Illinois
The Enhanced Coverage Option (ECO) is a new supplemental insurance program introduced this year, providing county coverage from 90% or 95% coverage level down to 86% (see farmdoc daily articles on November 24, 2020, December 8, 2020, December 10, 2020, December 15, 2020, December 22, 2020, February 23, 2021, March 2, 2021 for more information). The Supplemental Coverage Option (SCO) is another county-based policy that can be used, with or without ECO, to supplement underlying farm-level coverage.
Since ECO and SCO payments are triggered based on losses experienced at the county-level, indemnities may not always match losses experienced at the farm-level over the coverage range. This potential mismatch in loss coverage between farm and area insurance products is often referred to as basis risk and may reduce demand for county-level insurances (Yu et al. 2019).
This article compares some insurance coverage scenarios which use the ECO and SCO products with Revenue Protection (RP) coverage to a baseline case of 85% RP. This year, some farmers may have considered lowering there RP coverage level to 80% and then using SCO and ECO to provide protection above 80%. Herein, we look at the likelihood that county-based coverage triggers smaller payments than 85% RP, a situation also referred to as a “false negative” or under-compensation of farm-level losses.
Area Insurance Basis Risk
For our purposes, basis risk refers to the difference in losses between county-level outcomes and individual (farm-level) outcomes. Basis risk leads to the potential that a farmer who elects coverage with a county-level product will not be indemnified when farm-level losses occur, or not receive an indemnity that fully covers their individual loss (under compensated).
Basis risk is related to the correlation between farm yields and county yields, or how closely farm yields tend to follow the county over time. The stronger the correlation between a farm and the county, the lower the basis risk meaning a county-level product will more closely match coverage from a farm-level product. For the comparisons here, the correlation between farm and county yields is assumed to be 0.8 which is representative of the historical correlation observed between farm yields from Illinois FBFM and USDA-NASS county yields for central Illinois.
Policy Comparisons
Previous articles have compared premium costs across a range of coverage scenarios using individual and county-level policies (see farmdoc daily article on March 2, 2021 for more information). We assume an RP-85 policy – the maximum individual coverage level available – as the baseline against which to measure basis risk for alternatives that combine individual coverage with supplemental area coverage. The RP plan is by far the most popular individual plan of insurance, and farmers in the Midwest tend to choose the highest coverage levels available (see farmdoc daily from May 4, 2021). Specifically, we compare RP-85 to the following three alternatives:
- RP-80 + SCO
- RP-80 + SCO + ECO-90
- RP-80 + SCO + ECO-95
RP-80 with SCO results in some premium cost savings relative to RP-85 with a similar overall coverage level (86% SCO trigger). RP-80 with SCO and ECO-90 generally results in similar farmer-paid premium costs as RP-85 with a slightly higher coverage level of 90%. Using ECO-95 increases both the coverage level and premium cost. For all three comparisons, some farm-level coverage is traded off for county-level coverage, specifically the range from 80% to 85%.
To quantify basis risk, we use simulation analysis to generate farm-level and county-level yields, and harvest insurance prices for corn. Harvest prices are simulated based on the projected insurance price and volatility factor from the Risk Management Agency (RMA) for the 2021 crop year ($4.58/bu projected price and 0.23 volatility factor).
Scenarios for Champaign (low risk) and Monroe (high risk) Counties in Illinois are examined. Estimated premiums for each policy combination are calculated as the average indemnity across the simulations. Farmer-paid premium costs ($/acre) for the policy and county scenarios that incorporate subsidy discounts are given in Table 1. Premiums for RP-80+SCO are lower than for RP-85. Farmer-paid premiums for RP-85 and RP-80+SCO+ECO-90 are very similar for Champaign County, while the RP-80+SCO+ECO-90 premium is a few dollars cheaper per acre than RP-85 for Monroe county. Premium costs further increase for the RP-80+SCO+ECO-95 policy reflecting the increase in coverage level from 90% to 95%.
 Indemnity Payment and Basis Risk
To examine basis risk, the indemnity payments from the policy combinations using the supplemental area plans are compared against RP-85 coverage. RP-85 is used as the benchmark comparison, or the measure of whether farm-level losses occurred.
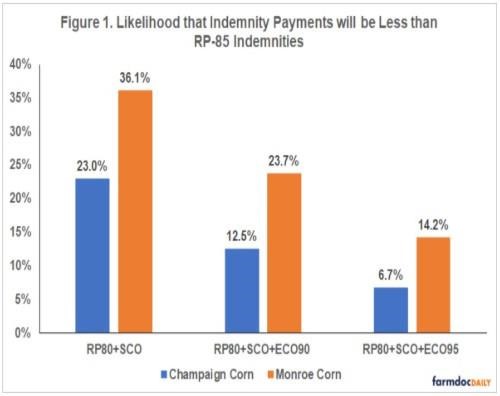
For Champaign County, RP-85 would trigger an indemnity payment with a likelihood of 38%. The likelihood that the individual and area plan coverage combinations will trigger indemnity payments less than the RP-85 policy are reported in figure 1. These likelihoods measure how often the individual and area plan combinations will under-compensate farm-level losses.

For RP-80+SCO indemnity payments would be less than RP-85 with a likelihood of 23%. The likelihood of zero payments from the RP-80 combinations when RP-85 would trigger payments is 4.6%. The likelihoods of under-compensation decline to 12.5% and 6.7% when ECO-90 and ECO-95, respectively, are also added to the coverage plan. The likelihood of zero payments from the individual and county coverage combinations with ECO when 85-RP would trigger payments falls to 3% (ECO-90) and 1.3% (ECO-95).
For Monroe county, the likelihood of RP-85 triggering payments is 45%, reflecting the greater yield risk relative to Champaign county. For RP-80+SCO indemnity payments would be less than RP-85 with a likelihood of 36.1%. The likelihood of zero payments from the RP-80 combinations when RP-85 would trigger payments is 3.2%. The likelihood of under-compensation declines to 23.7% and 14.2% when ECO coverage is added. The likelihood of zero payments from the individual and county coverage combinations with ECO when 85-RP would trigger payments falls to 2.6% (ECO-90) and 1.6% (ECO-95).
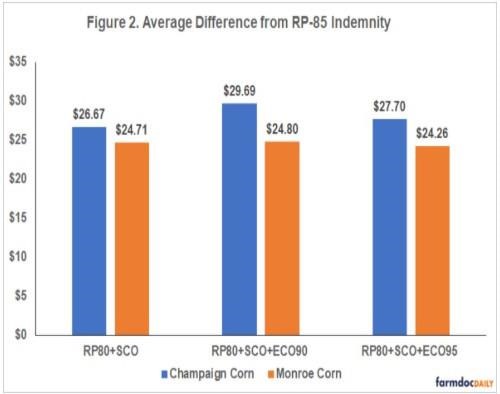
Figure 2 reports the average indemnity payment difference when the individual and area plan combinations under-compensate losses, or a measure of the average level of under-compensation when it occurs. The average level of under-compensation is between $26 and $30 per acre for Champaign County, and $24 to $25 per acre for Monroe County. The average indemnity payment differences don’t vary significantly across the alternative policy scenarios. The majority of outcomes where under-compensation occurs are when farm-level losses are in the range of 80% to 85% (resulting in no payment from the RP-80 policy), and either zero or very small losses triggered by the county-based coverage.

Net Indemnity
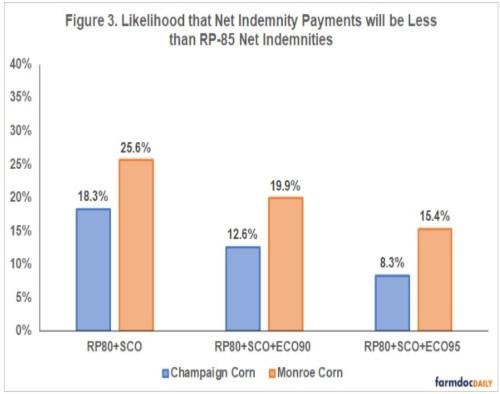
To incorporate the effect of premium costs, the same comparisons are also made for net indemnities (indemnities less farmer-paid premium). Figure 3 reports the estimated likelihoods that the individual and area plan combinations trigger net indemnity support less than the net indemnity from RP-85 when farm-level losses occur.

For the Champaign County scenario this occurs 18.3% of the time for RP-80+SCO. This declines to 12.6% and 8.3% when ECO-90 and ECO-95 are added, respectively. For Monroe county the likelihoods of net indemnity under-compensation are greater due to higher overall risk. Likelihood of smaller net indemnities from RP-80+SCO is 25.6% and decline to 19.9% and 15.4% when ECO-90 and ECO-95 are added, respectively.
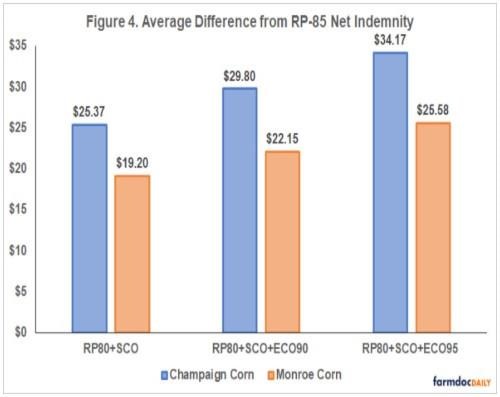
The average net indemnity differences across coverage scenarios are given in figure 4. For Champaign county the average level of under-compensation relative to RP-85 net indemnities is about $25 per acre for RP-80+SCO and increases to $34 per acre when ECO-95 is added. For Monroe county the average level of under-compensation relative to RP-85 net indemnities is about $19 per acre for RP-80+SCO and increases to nearly $26 per acre when ECO-95 is added. When looking at indemnities the average level of compensation was similar across the three policy alternatives with county-based coverage (figure 2). The average level of net indemnity under-compensation increases as more county-coverage is used because of the increasing premium cost associated with SCO and ECO programs.

Summary
With the introduction of SCO in the 2014 Farm Bill and ECO in 2021, farmers now have the ability to use area plans of insurance along with individual coverage to increase their overall coverage level. Some farmers might consider altering their insurance coverage plans by reducing individual coverage and adding the supplemental county-based plans to balance the added premium cost. However, since the area plans are triggered by county, rather than farm, yields the potential mismatch in losses – or basis risk- is introduced.
In a relatively low risk county (Champaign), the likelihood that indemnities from the combination coverage scenarios is less than what would be paid from RP-85 is between 6.7% and 23%. These likelihoods increase to 14.2 to 36.1% for the higher risk county (Monroe) scenario. The likelihood of under-compensation of indemnities declines as more supplemental county coverage is added. The average level of under-compensation in those outcomes is between $25 and $30 per acre.
Incorporating premium costs, there is also the potential for net indemnities from the coverage scenarios using the supplemental area plans to under-compensate relative to net indemnities from RP-85. These likelihoods range from 8.3% to 18.3% for Champaign, and 15.4% to 25.6% for Monroe. The average level of under-compensation of net indemnities, when it occurs, ranges from $25 to $34 ($19 to $26) per acre in Champaign (Monroe), and increases as greater levels of supplemental county-based coverage are added.
Thus, while the supplemental area plans create more coverage options, farmers need to be aware of and carefully consider this potential for mismatch in coverage introduced by using an area plan cover a portion of their risk. Here we focused on revenue outcomes where the policy combinations using supplemental area plans under-compensate relative to the highest available coverage individual plan (RP-85). In future articles we will cover scenarios where the area plan combinations over-compensate farm-level losses, premium cost considerations when losses are not triggered, and overall risk reduction comparisons between individual coverage and combinations of individual and area coverage.
Source : illinois.edu